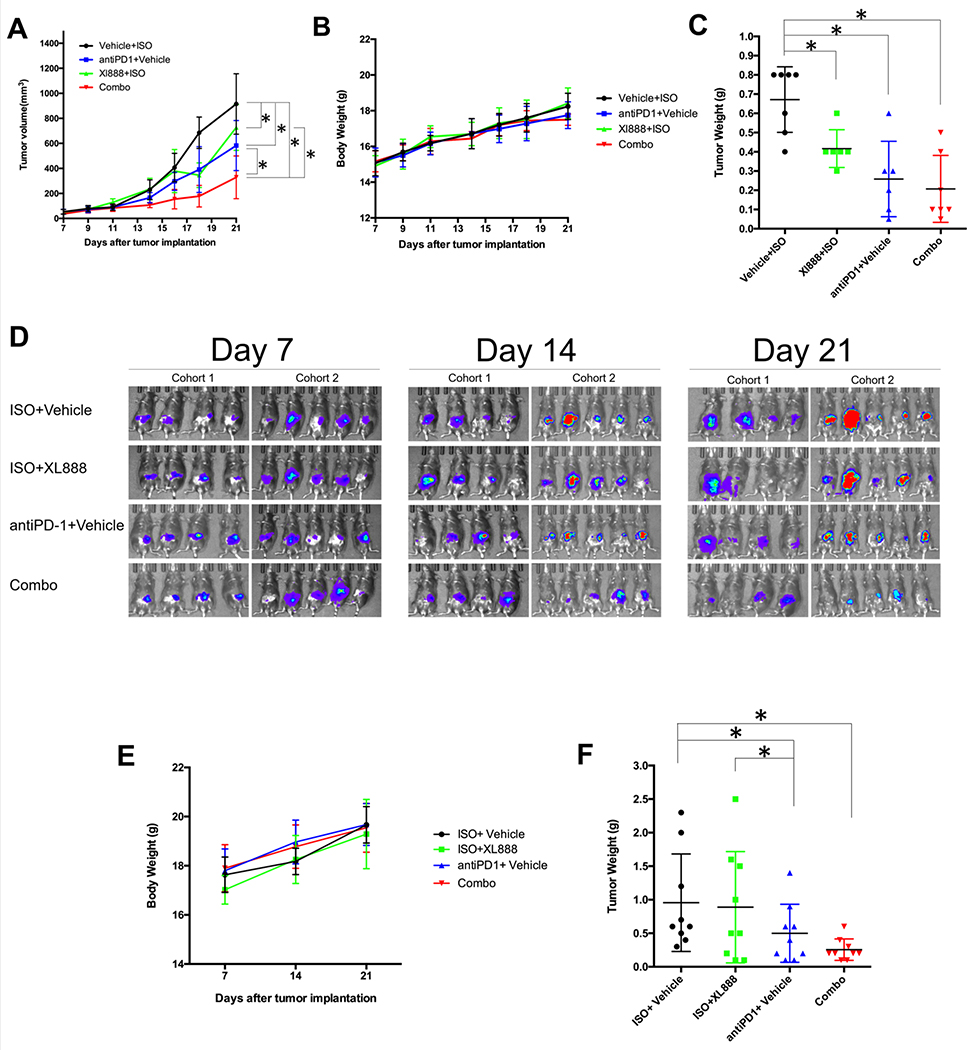
Figure. 4. In vivo activity of XL888 and anti-PD-1.
(A) Tumor volume was measured over time in mice bearing subcutaneous panc02 tumors. Treatment started on day 7 once tumors were palpable. (B) Body weight over time. Error bars represent standard deviation from n=6-7 mice per group. (C) End study tumor weight from each animal. Each dot represents an individual mouse tumor with the bar representing the mean. *A mixed model with pairwise comparisons revealed p<0.0001 in combination therapy vs. the three other groups. ISO = isotype control antibody. (D) Bioluminescent images (BLI) of mice confirming implantation of luciferase expressing KPC cells at Day 7 post-tumor implantation, and at various time points during the study. Treatment was initiated on Day 7 following tumor implantation and continued to the study endpoint at Day 21. This study was conducted in two separate cohorts of mice, as displayed. (E) Body weight over time and (F) end study tumor weight from each animal. Each dot represents an individual mouse tumor with the bar representing the mean. Error bars represent the standard deviation from n=9 mice per treatment group. ISO = isotype control antibody.

