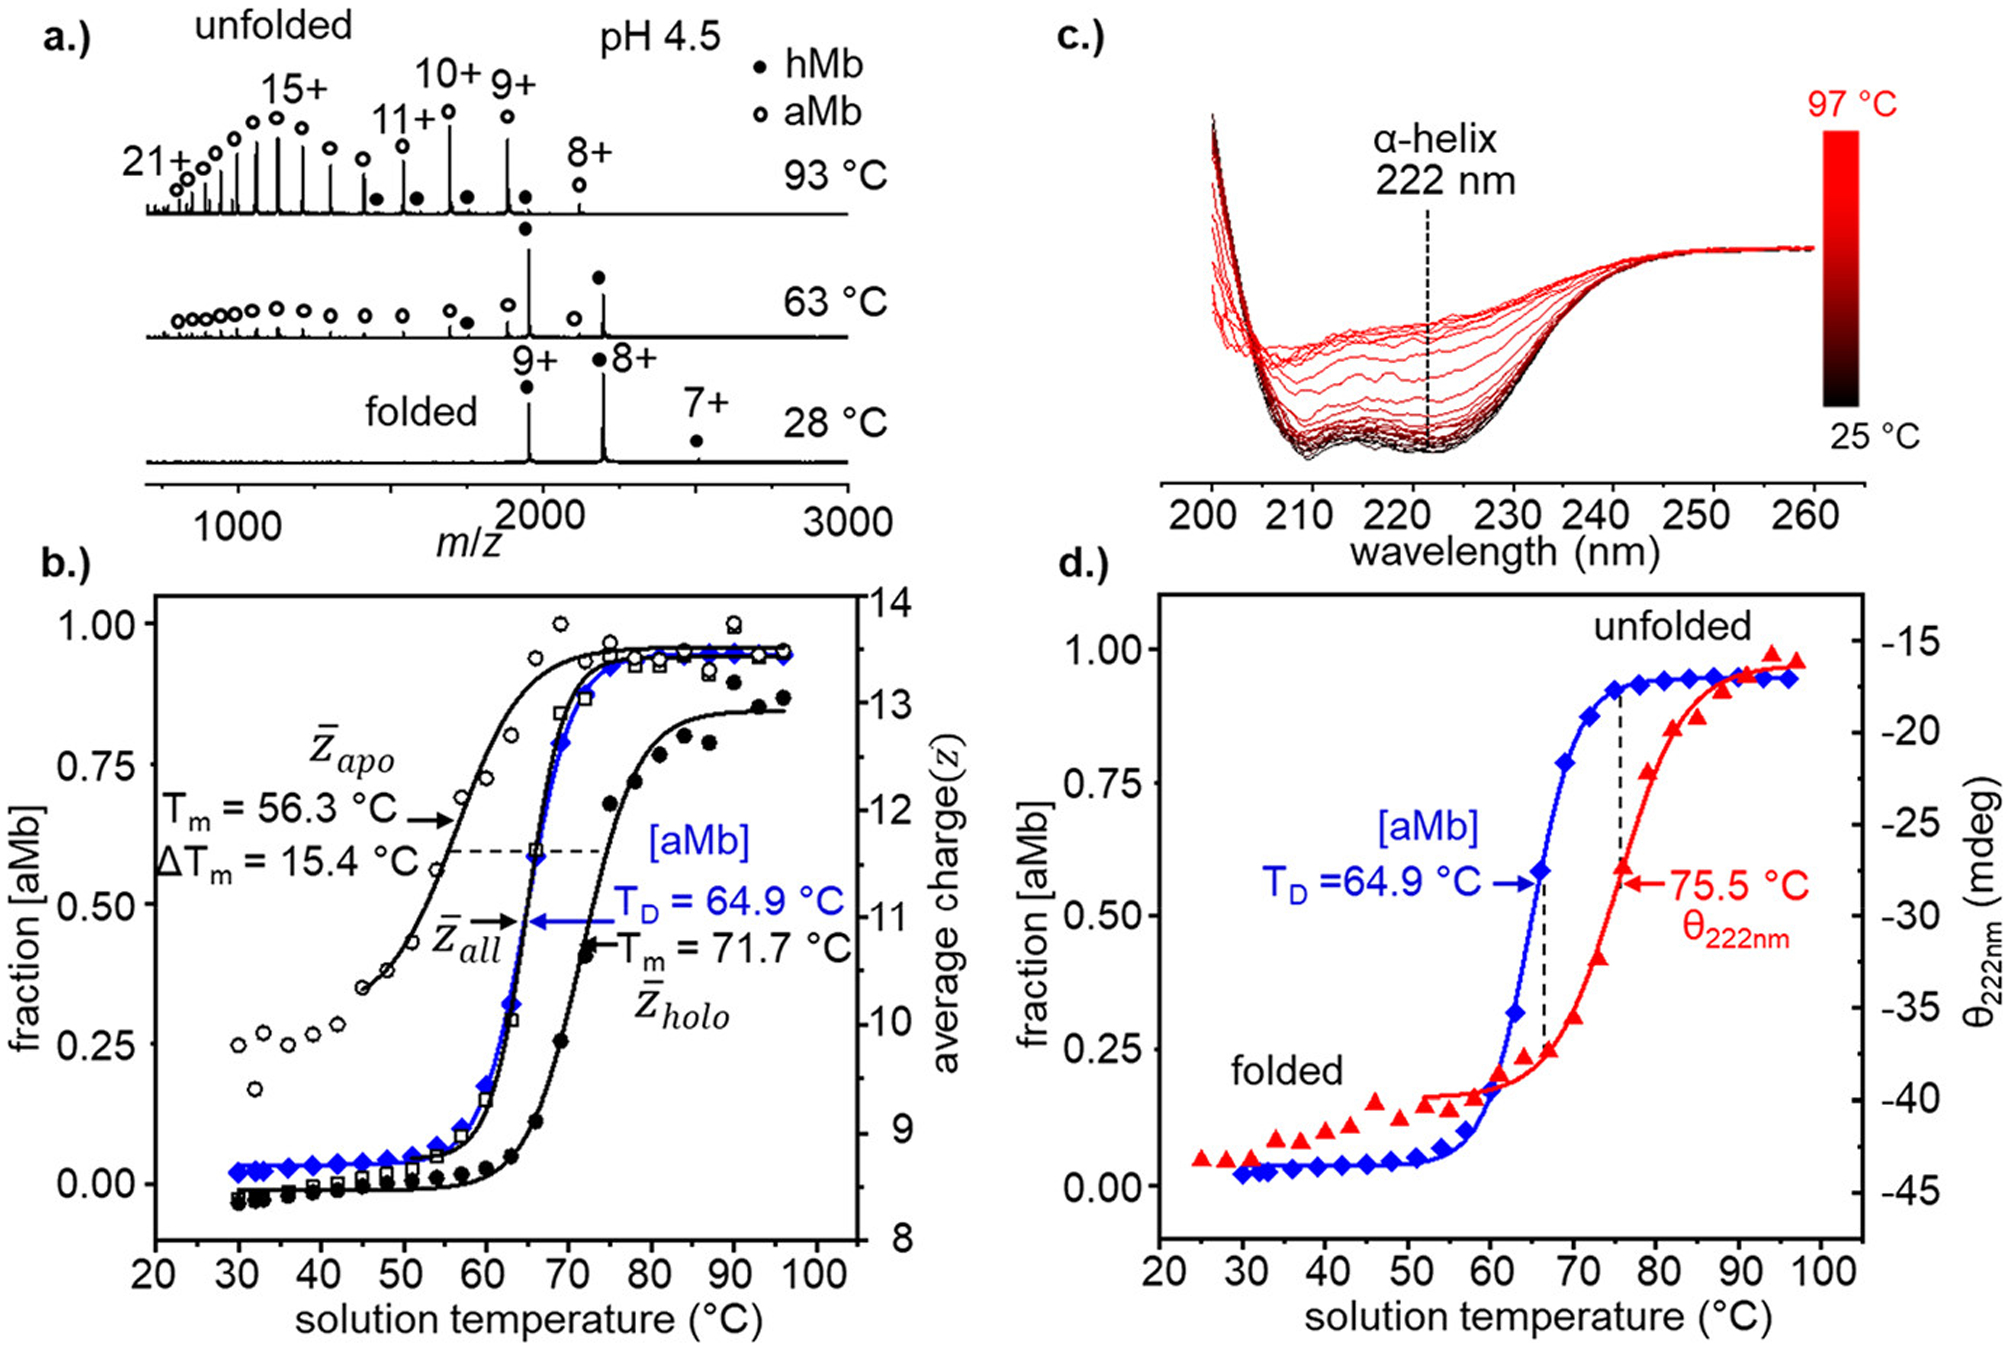
Figure 1.

(a) Normalized vT-ESI mass spectra of hMb (in 10 mM NH4OAc, pH = 4.5) at solution temperatures of 28, 63, and 93 °C. Heme-bound hMb states are indicated by filled black circles and heme-free aMb species with open circles. (b) Temperature-dependent stability curves derived from the formation of aMb (blue diamonds) on the left axis and the average charge state plots of (open black squares), (open black circles), and (filled black circles). Data points from T = 28 to 42 °C are excluded in the model of due to low signal/noise. (c.) Temperature-dependent CD spectra of hMb (in 10 mM NH4OAc, pH = 4.5) with the characteristic negative α-helix peak at 222 nm indicated with a dotted line. (d) Comparison of loss of α-helical structure measured by CD (red triangles) with formation of aMb from MS measurements (blue diamonds).
