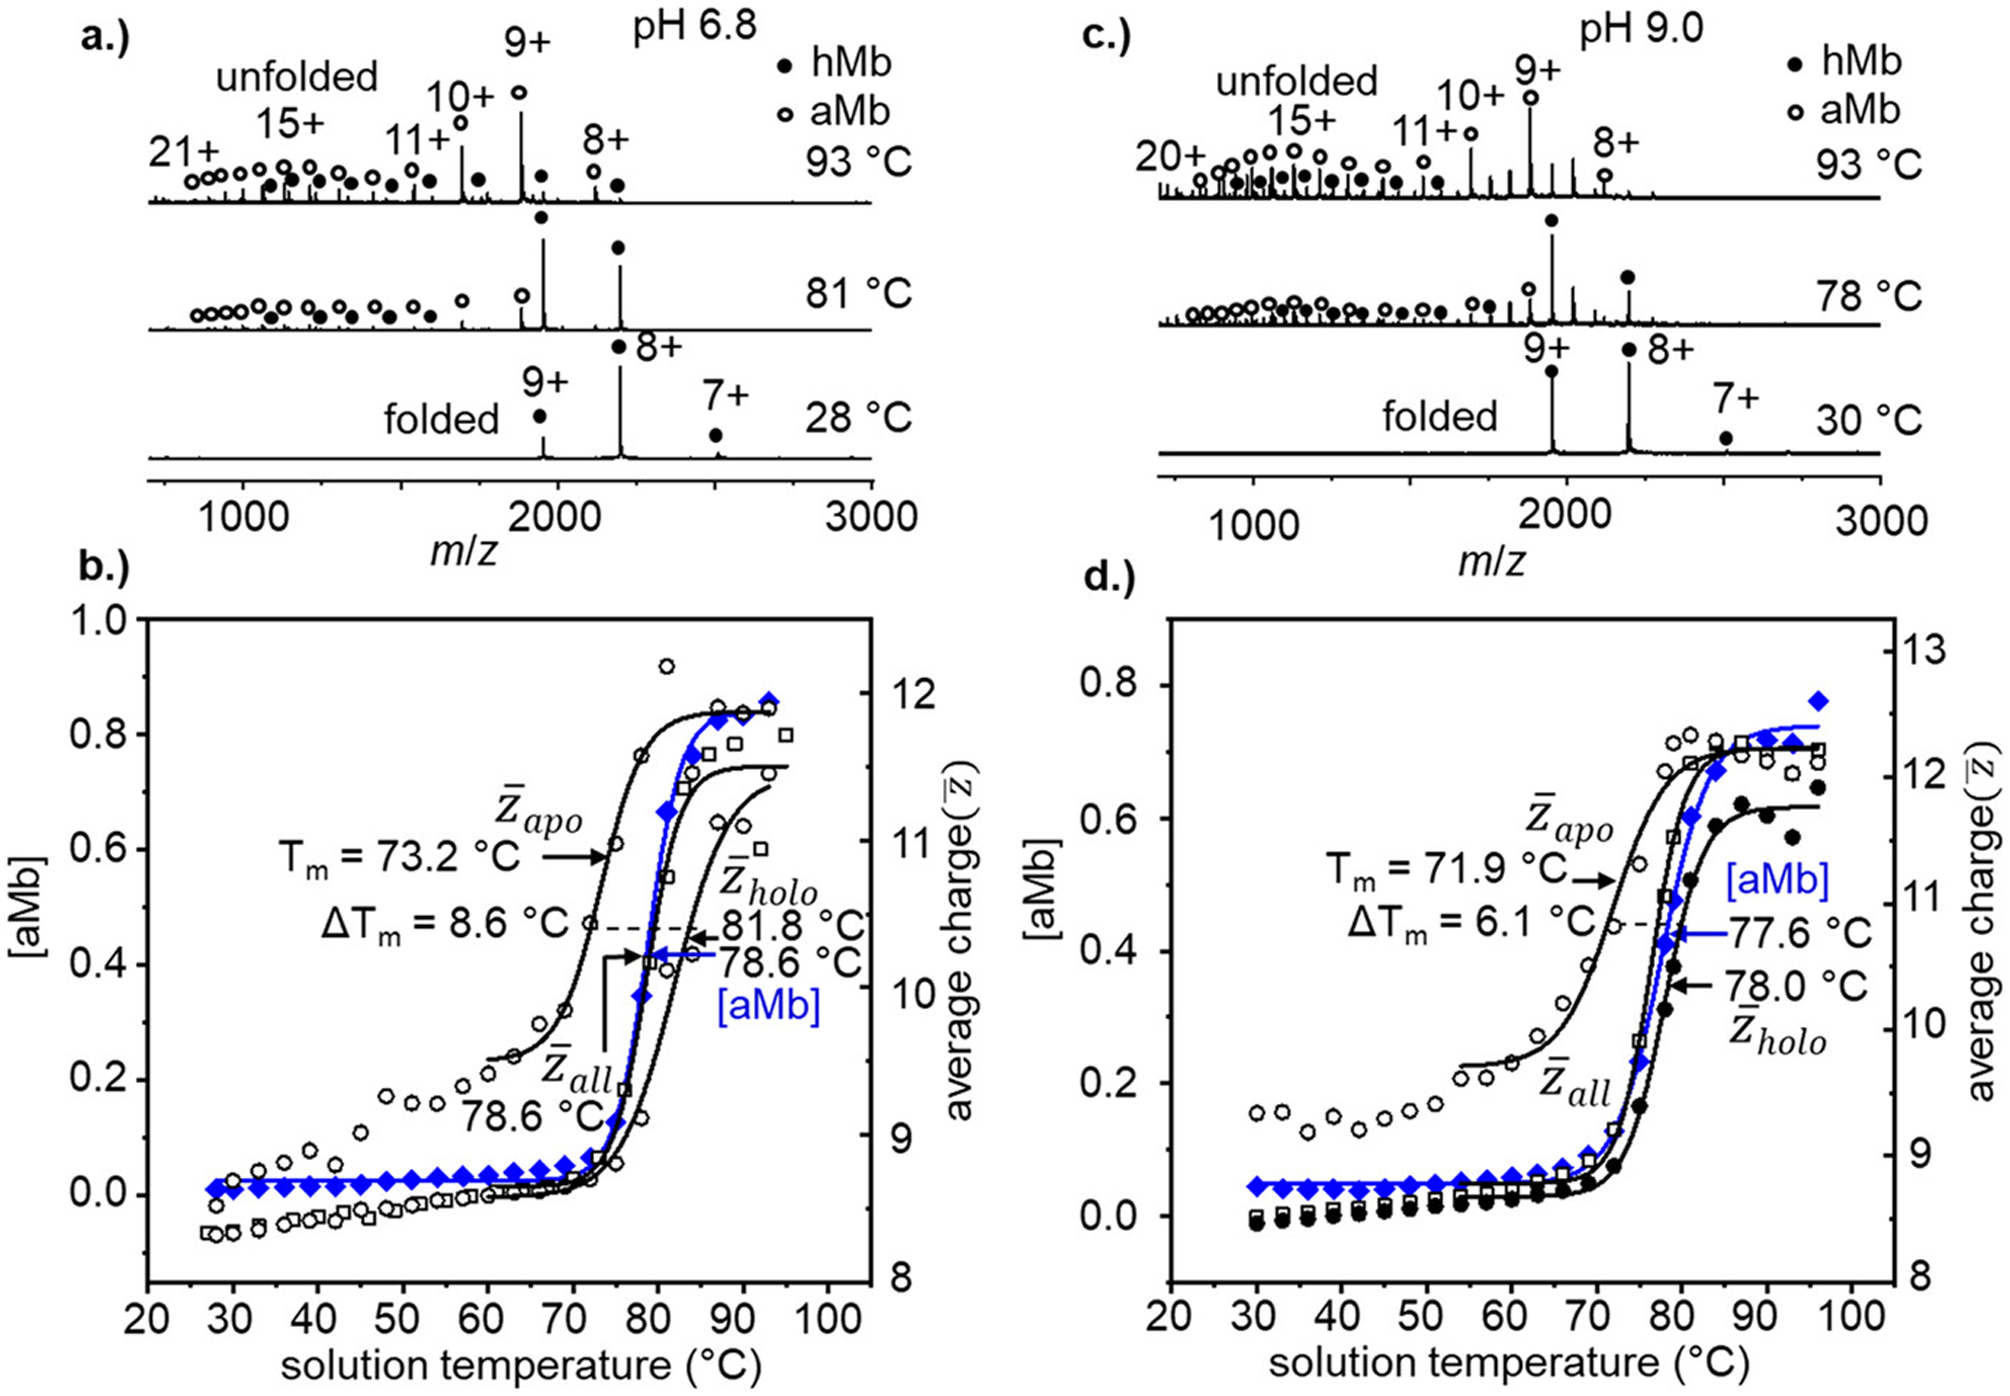
Figure 2.

(a) Representative vT-ESI mass spectra of hMb (in 10 mM NH4OAc pH = 6.8) at solution temperatures of 28, 81, and 93 °C. Heme-bound hMb states are indicated with filled black circles, and heme-free aMb species with open circles. (b, d) Temperature-dependent stability curves showing [aMb] (blue diamonds) on the left axis and the average charge state plots of (open black squares), (open black circles), and (filled black circles). (c) Representative vT-ESI mass spectra of hMb (in 10 mM NH4OAc pH = 9.0) at solution temperatures of 30, 78, and 93 °C.
