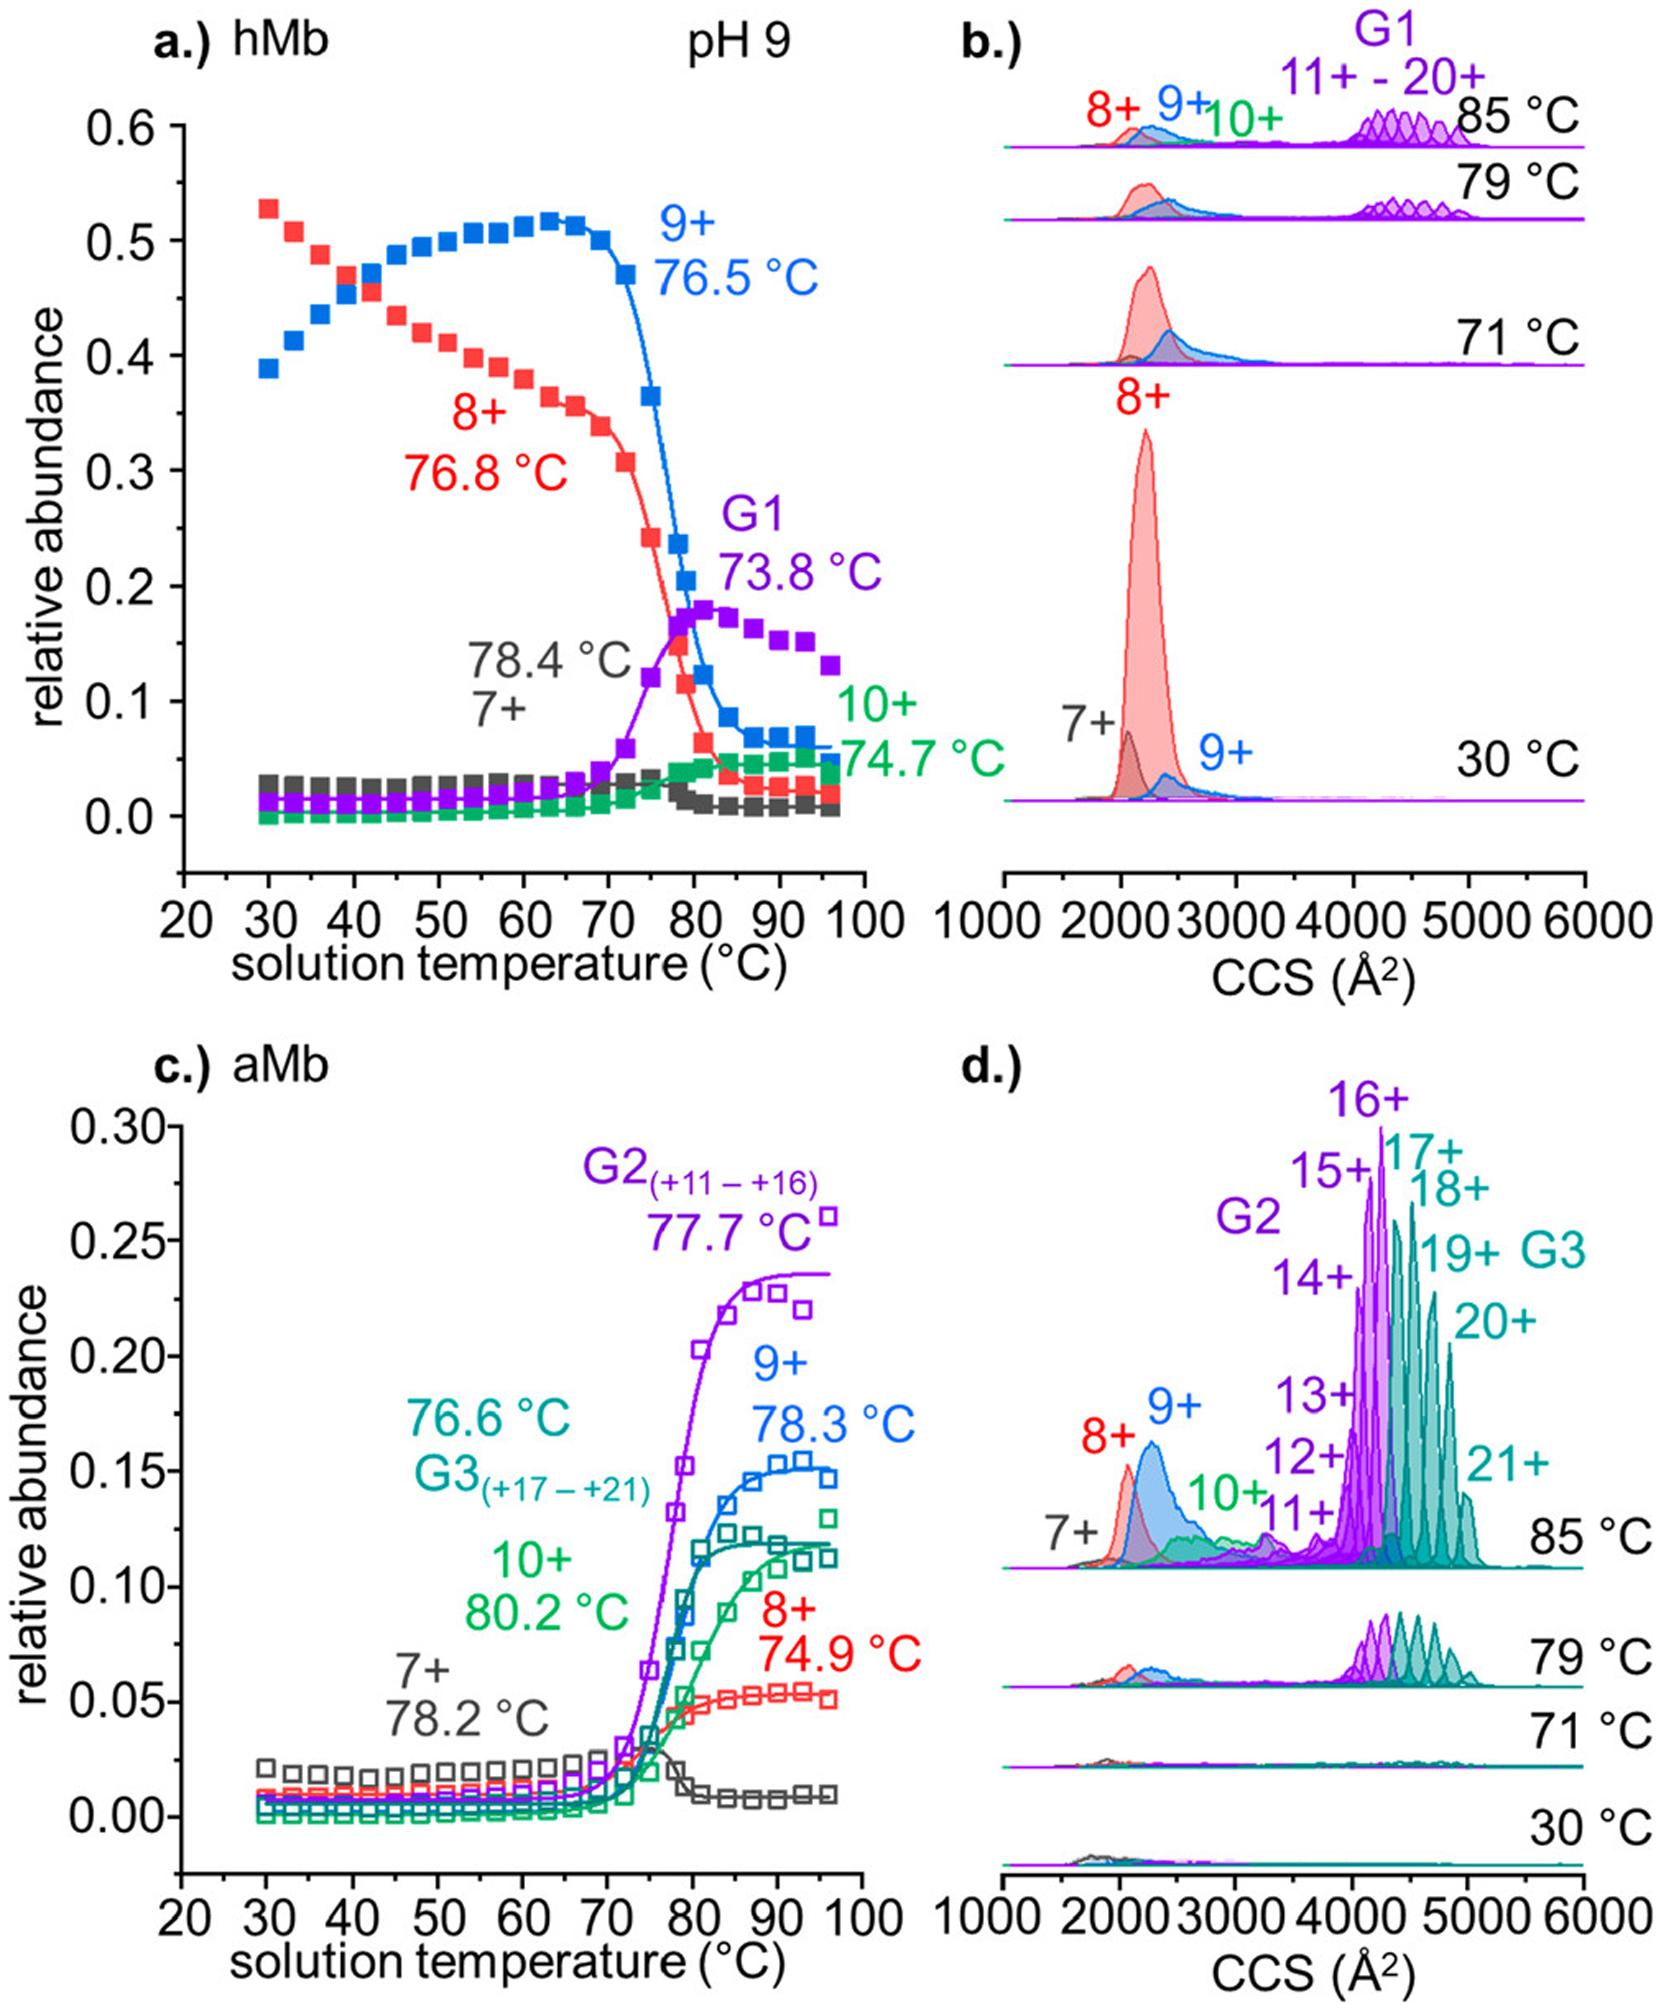
Figure 4.

(a) Relative abundance of all observed hMb species as a function of temperature. Midpoint Tm values are annotated next to each curve. Abundances are normalized to the total intensity of all observed Mb species. (b) Representative CCS distributions of each hMb charge state acquired at solution temperatures of 30, 71, 79, and 85 °C. (c) Normalized abundance plot of all aMb species as a function of solution temperature. (d) Representative CCS plot of all aMb charge states at 30, 71, 79, and 85 °C. Features in CCS distributions are color mapped to their representative abundance curves. Midpoint Tm and Tf values are annotated the corresponding trace in the relative abundance profiles.
