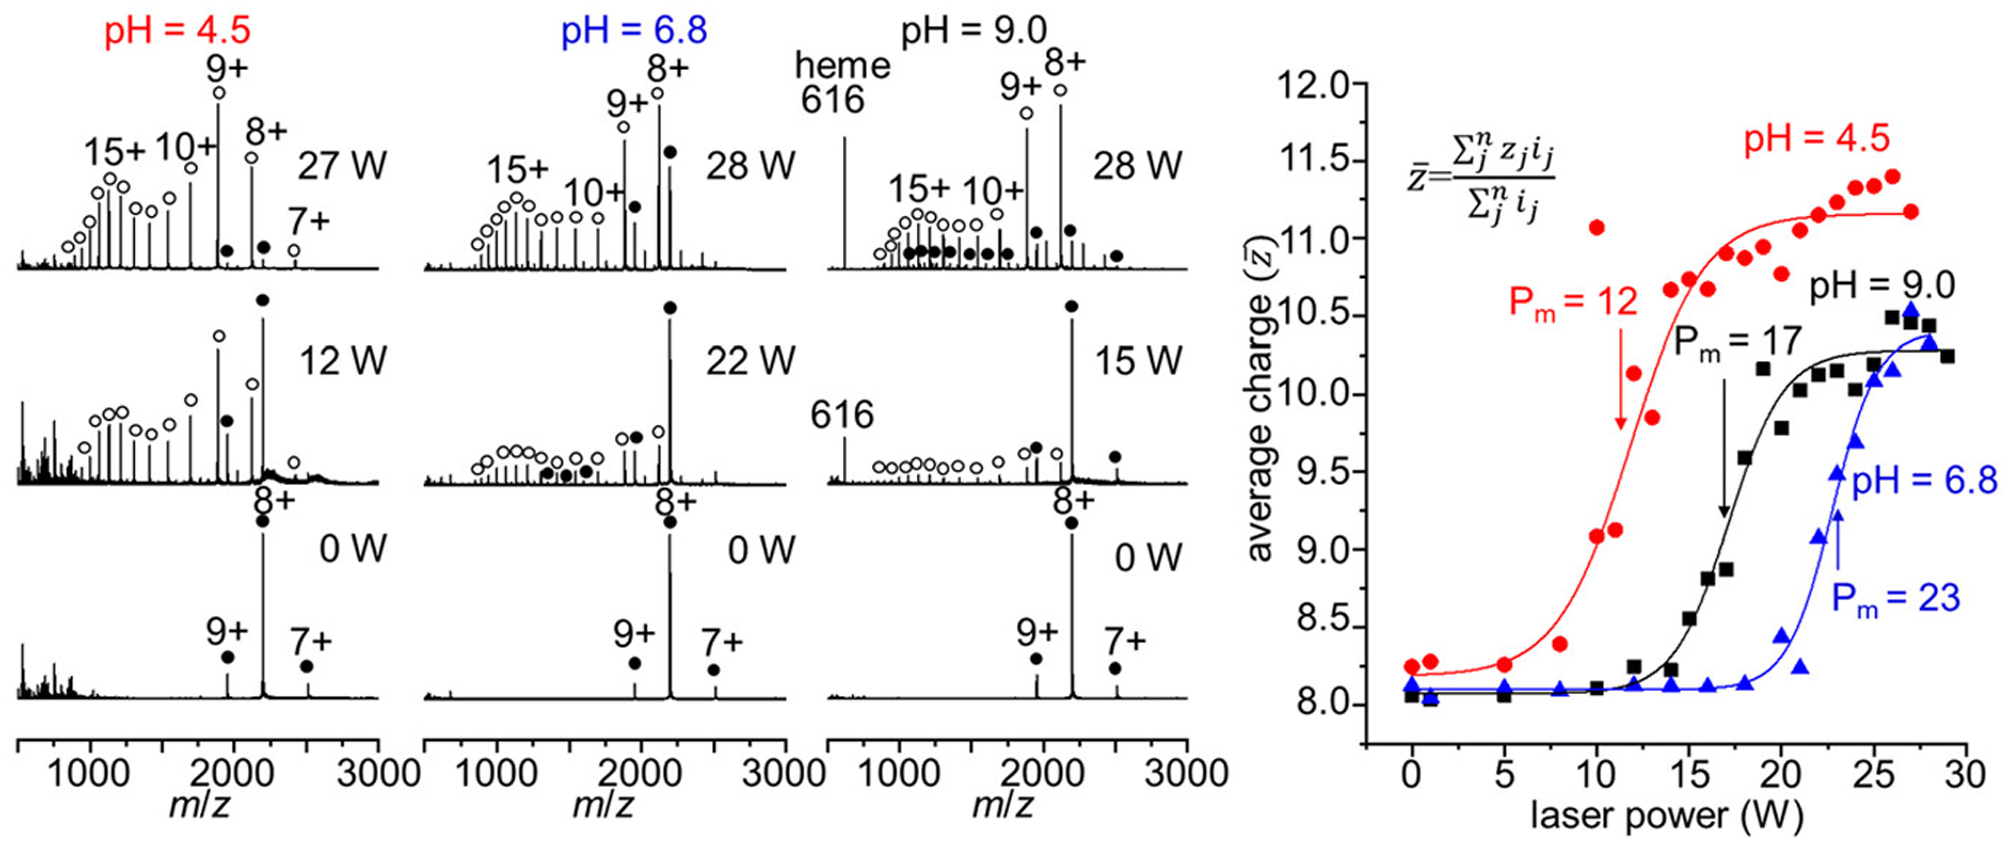
Figure 5.

Mass spectra acquired with increasing IR laser irradiation of the ESI droplets of hMb solutions at pH 4.5, 6.8, and 9.0 (left). Average charge state plots as a function of IR laser power (right). Midpoint Pm values are indicated on the sigmoidal curves with arrows.
