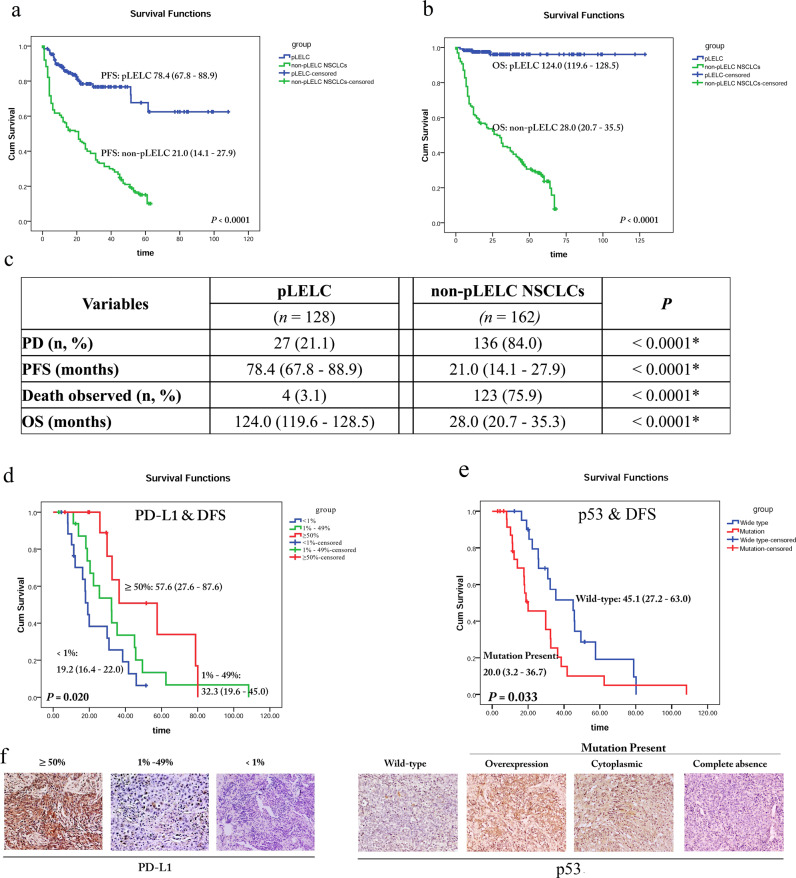
Fig. 2. Prognosis of pLELC by Kaplan–Meier survival analyses with log-rank test.
a The PFS probability of pLELC patients compared with non-pLELC NSCLC patients (78.4 months vs. 21.0 months, P<0.0001). b The OS probability of pLELC patients compared with non-pLELC NSCLC patients (124.0 months vs. 28.0 months, P<0.0001). c Information in detail. *P<0.05 with a significant difference. Both PFS and OS are estimated by the mean PFS value due to the high censor rate. d The DFS probability of pLELC patients with different PD-L1 expression levels in tumor cells (median DFS: 19.2 vs. 32.3 vs. 57.6 months for <1%, 1–49%, and ≥50% PD-L1 expression, respectively, P=0.020). e The DFS probability of pLELC patients with mutation-type or normal p53 expression (median DFS: 20.0 vs. 45.1 months respectively, P=0.033). f Representative images of PD-L1 and p53 expression by IHC (magnification ×400). P<0.05 indicates a significant difference

