Fig. 3.
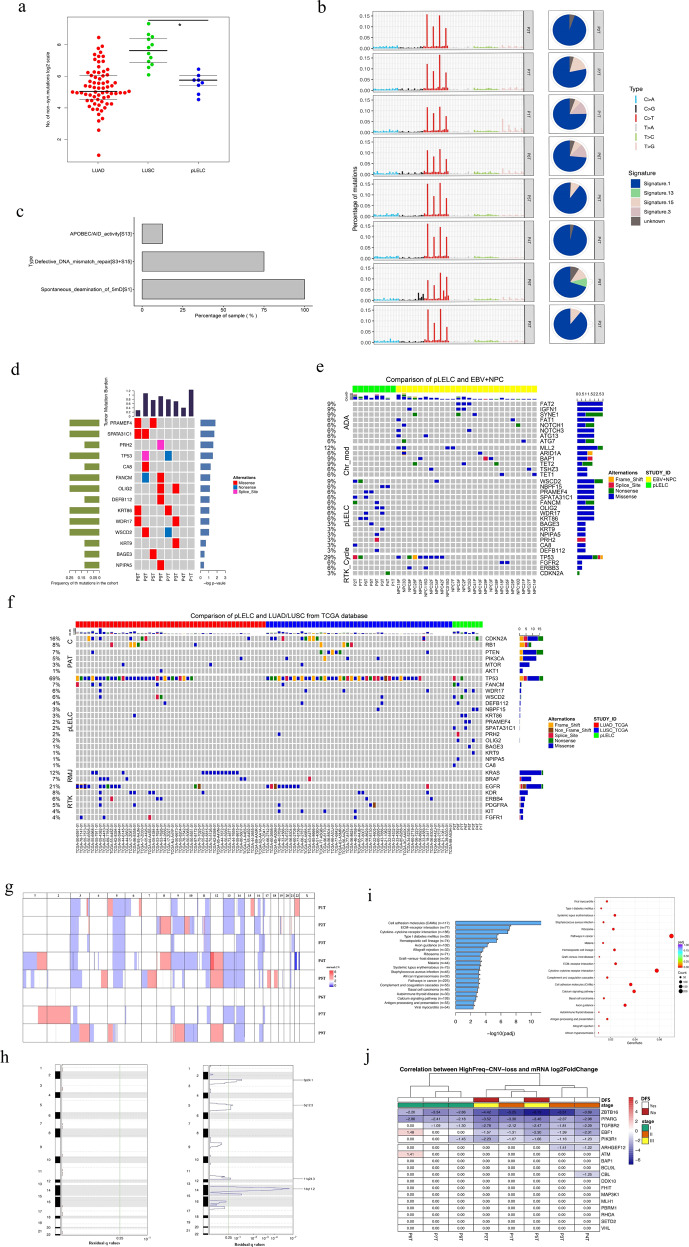
Mutation spectrum and CNV landscape of pLELC with enrichment analysis. a Nonsynonymous mutation counts in LUAD (red), LUSC (green), and pLELC (blue); the y-axis represents the log2 count. b Mutation signature analysis in patients with pLELC. Each subgraph shows a single pLELC sample, and the bar displays different base alteration types, with the pie chart depicting the proportions of different signature types. c Percentages of samples harboring different mutation signatures. d Mutation landscapes of eight pLELC samples. The red, blue, and pink represent missense, nonsynonymous, and shear site mutations, respectively. The bar on the left shows the mutation frequency in the population. e Comparison of genomic mutation profiles between pLELC and NPC. f Comparison of genomic mutation profiles between pLELC, LUAD, and LUSC. The bars at the top of the chart represent different tumor types. The color blocks represent different types of base alterations, with the mutation frequency of the population presented on the left. g Overview of the pLELC CNV landscape. Each row represents one sample; the red and blue squares represent gains and losses, respectively, and the x-axis represents the chromosome number of the whole human genome. h High-frequency CNVs of segments in pLELC. CNV gain is shown on the left, and CNV loss is shown on the right. The purple line on the right represents a wide peak limit. i Pathway enrichment analysis. Left: the x-axis represents −log2 values (adjusted P values), and the y-axis represents the different signaling pathways and the number of genes involved. Right: the x-axis represents the gene ratio in each pathway, and the red circle denotes a low adjusted P value. j Integrated analyses of the transcriptome combined with genome CNV. Each column represents a sample, and each row represents the gene with high-frequency CNV loss. At the top of the diagram are annotations of the sample clinical information, representing the DFS time, as well as the clinical staging. The figure shows the mRNA expression of this gene in the cancer sample relative to the control log2-fold change. ZBTB16 and PPARG were lost and downregulated in 100% (8/8) of patients with pLELC; the mRNA log2-fold changes in ZBTB16 and PPARG were −2.20 to −6.15 and −2.37 to −3.46, respectively. TGFBR2 was lost and downregulated in 87.5% (7/8) of patients, with a −1.09 to −2.78 log2-fold change in mRNA. NPC nasopharyngeal carcinoma, LUAD lung adenocarcinoma, LUSC lung squamous cell carcinoma

