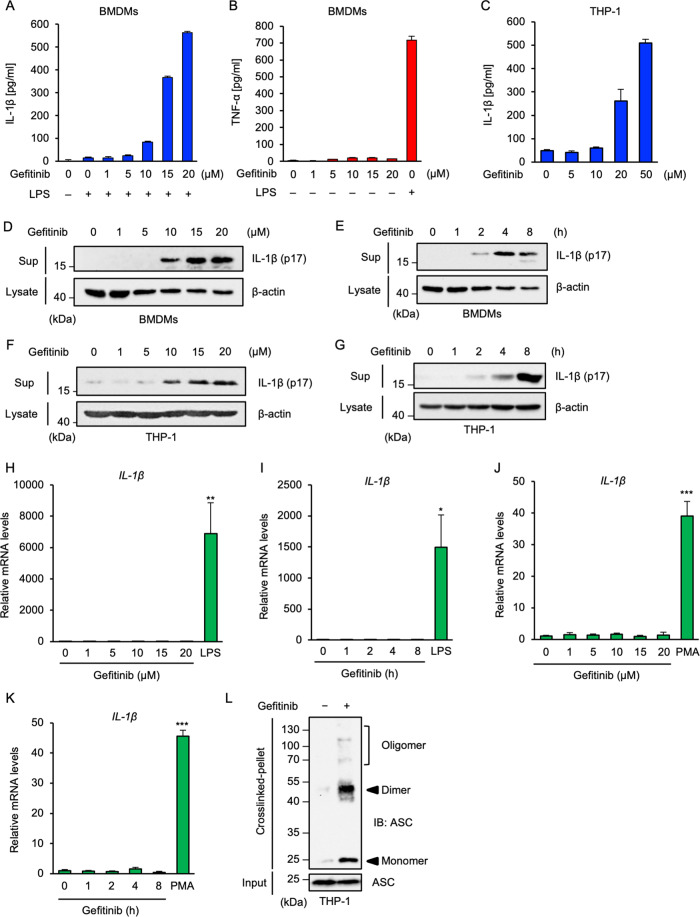
Fig. 1. Gefitinib promotes mature-IL-1β release in macrophages.
A, B ELISA analysis of cytokines in culture supernatants of BMDMs. LPS-primed or unprimed BMDMs were treated with the indicated concentrations of gefitinib for 8 h. IL-1β (A) or TNF-α (B) release were analyzed by ELISA. C ELISA analysis of cytokines in culture supernatants of THP-1 cells. PMA-differentiated THP-1 cells were treated with the indicated concentrations of gefitinib for 8 h. IL-1β release was analyzed by ELISA. D, E Immunoblot analysis of IL-1β in culture supernatants of BMDMs. LPS-primed BMDMs were treated with the indicated concentrations of gefitinib for 8 h (D), or treated with 20 μM gefitinib for indicated periods (E). Cell-free supernatants (Sup) and cell lysates were subjected to immunoblotting with the indicated antibodies. F, G Immunoblot analysis of IL-1β in culture supernatants of THP-1 cells. PMA-differentiated THP-1 cells were treated with the indicated concentrations of gefitinib for 8 h (F), or treated with 20 μM gefitinib for the indicated periods (G). Cell-free supernatants (Sup) and cell lysates were subjected to immunoblotting with the indicated antibodies. H, I The mRNA expression levels of IL-1β. BMDMs were treated with the indicated concentrations of gefitinib for 8 h or 100 ng/ml LPS for 6 h (H), or treated with 20 μM gefitinib for indicated periods or 100 ng/ml LPS for 6 h (I). The mRNA levels of IL-1β were analyzed by quantitative real-time PCR (normalized with GAPDH mRNA levels). Graphs are shown as mean ± S.D. (n = 3). Statistical significance was determined by student’s t-test; *p < 0.05, **p < 0.01. J, K The mRNA expression levels of IL-1β. THP-1 cells were treated with the indicated concentrations of gefitinib for 8 h or 100 nM PMA for 4 h (J), or treated with 20 μM gefitinib for indicated periods or 100 nM PMA for 4 h (K). The mRNA levels of IL-1β were analyzed by quantitative real-time PCR (normalized with GAPDH mRNA levels). Graphs are shown as mean ± S.D. (n = 3). Statistical significance was determined by student’s t-test; ***p < 0.001. L ASC oligomerisation assay in THP-1 cells. PMA-differentiated THP-1 cells were treated with 20 μM gefitinib for 8 h. DSS-mediated crosslinked pellets (crosslinked-pellets) and soluble lysates (Input) were subjected to immunoblotting with anti-ASC antibody. All data in Fig. 1 are representatives of at least three independent experiments.

