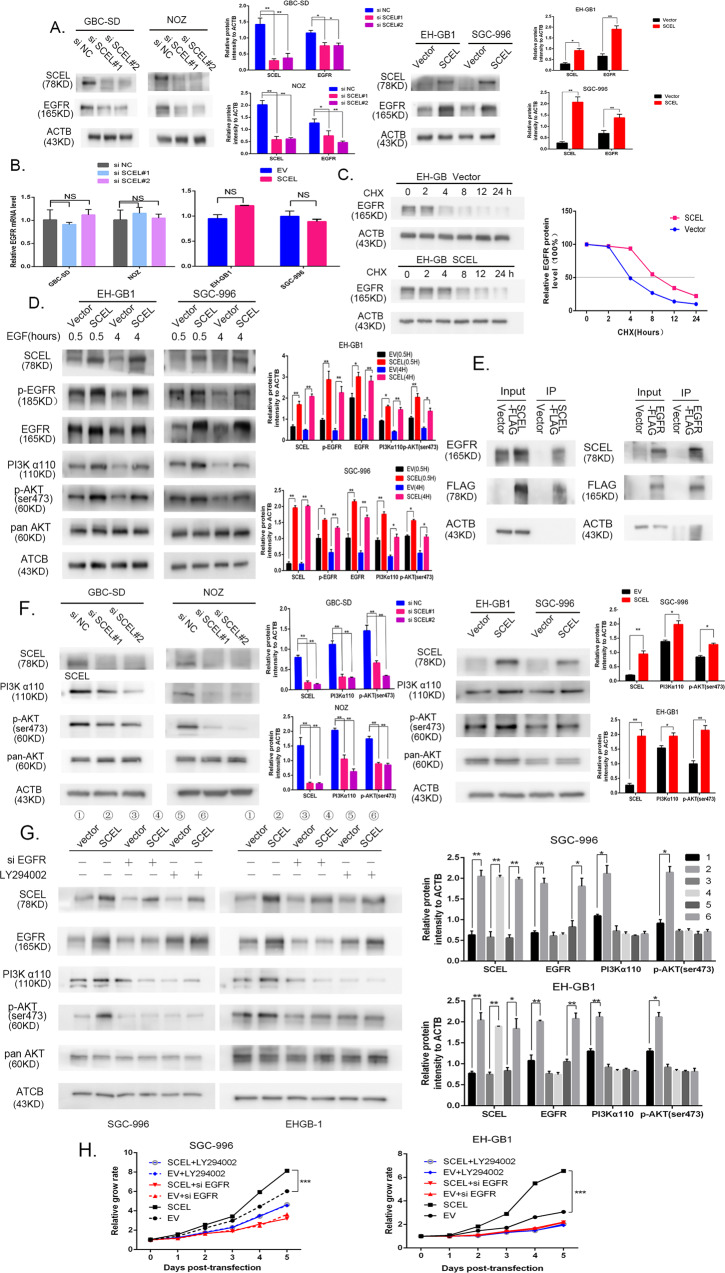
Fig. 3. SCEL promotes gallbladder cancer growth by stablizing EGFR protein expression.
A, B GBC cells with SCEL upregulation or downregulation were subjected to Western blotting (A) and RT-PCR (B) to detect the expression level of EGFR, grayscale statistics on the right side. C, EH-GB1 cells were transfected with EV and SCEL plasmid. After 12 h, cells were treated with 100 μM cycloheximide (CHX) for time periods as indicated. Western blotting analysis was conducted with EGFR and ACTB, representative immunoblots and the ratio of the indicated protein to ACTB are presented. D Control and SCEL overexpression plasmid- transfected (2 days) cells were serum-starved and stimulated with EGF for indicated times. Cell lysates were prepared and analyzed by immunoblotting using indicated antibodies, grayscale statistics on the right side. E Co-immunoprecipitation and Western blot analysis of SCEL and EGFR proteins from EH-GB1 cell line after transfected with SCEL-3FLAG or EGFR-3FLAG plasmid. F The indicated GBC cells subjected to Western blotting to detect the level of PI3Kα110, p-AKT(ser473) pan AKT, grayscale statistics on the right side. G The indicated GBC cells were incubated with or without EGFR siRNA20 μM LY294002 and then subjected to Western blotting to detect the expression level of EGFR, PI3Kα110, p-AKT(ser473), pan AKT. The incubation times is as follows: LY294002, 12 h, grayscale statistics on the right side. H GBC cells were transfected EV or SCEL plasmid and treated EGFR siRNA or LY294002 and CCK8 assay was perfromed to determine its proliferation. *p < 0.05; **p < 0.001, ***p < 0.001.

