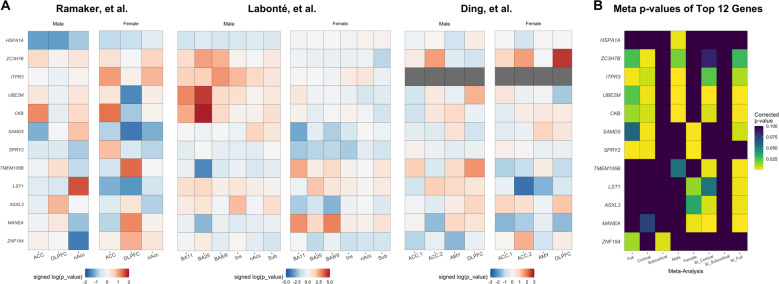
Fig. 2. Heatmap visualizations of differential expression results.
a Study-specific direction signed log(p-values) for the top 12 genes separated by sex and region. Cell colours range from blue to red, which represents lower and higher expression in cases compared to controls, respectively. Colour intensity represents the degree of differential expression. Missing values are marked in gray. b Corrected meta p-values for the same genes across the 8 across-study meta-analyses. Cell colours range from low (yellow) to high (purple) corrected p-values in each meta-analysis. ACC anterior cingulate cortex (two studies), DLPFC dorsal lateral prefrontal cortex, nAcc nucleus accumbens, Ins anterior insula, Sub subiculum, AMY amygdala, SI sex interaction.

