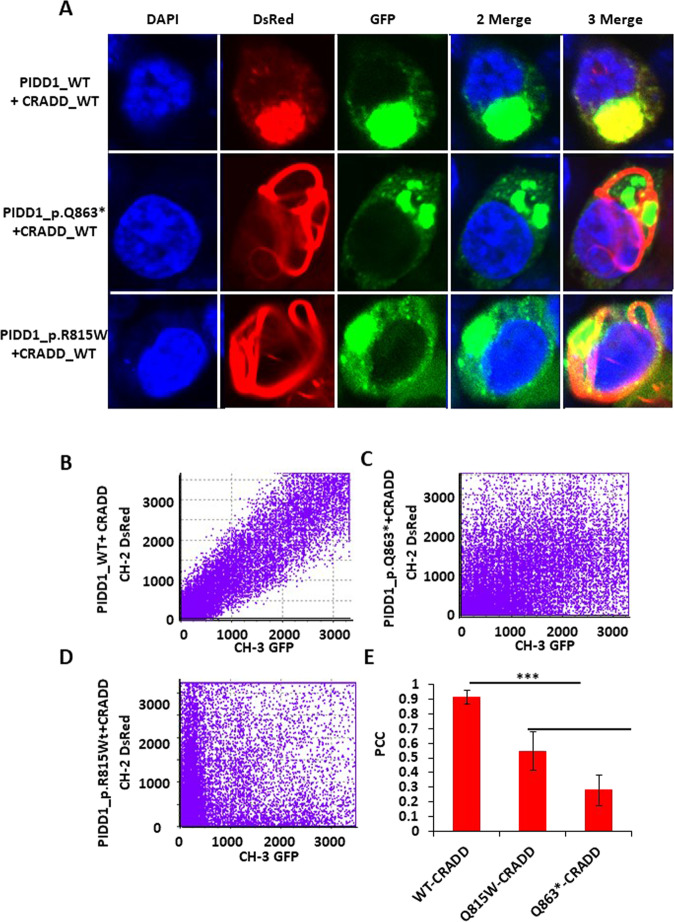
Fig. 3. Co-localization analysis in HEK293T cells co-expressing PIDD1-FL C-terminally fused with GFP and CRADD C-terminally fused with DsRed protein.
A Column 1 DAPI, column 2 DsRed, column 3 GFP, column 4 two merge (DAPI-GFP), and column 5 three merge (DAPI-GFP-DS-Red). (Top row) 512 × 512 image stacks showing full-length WT PIDD1-GFP fusion protein and full-length WT CRADD-DsRed fusion protein. (Middle row) 512 × 512 image stacks showing full-length Q863*PIDD1-GFP fusion protein and full-length WT CRADD-DsRed fusion protein. (Bottom row) 512 × 512 image stacks showing full-length R815W PIDD1-GFP fusion protein and full-length WT CRADD-DsRed fusion protein. B–D Plot representing overlapping pixels of X-axis (CH2-DS-red) and Y-axis (CH3-GFP) of WT-CRADD and PIDD1-WT, PIDD1-R815W, and PIDD1-Q863*, respectively. E Quantitative PCC values of same as B–D. n = 10 ±SEM bar shown ***p ≤ 0.0001; unpaired Student’s t-test.

