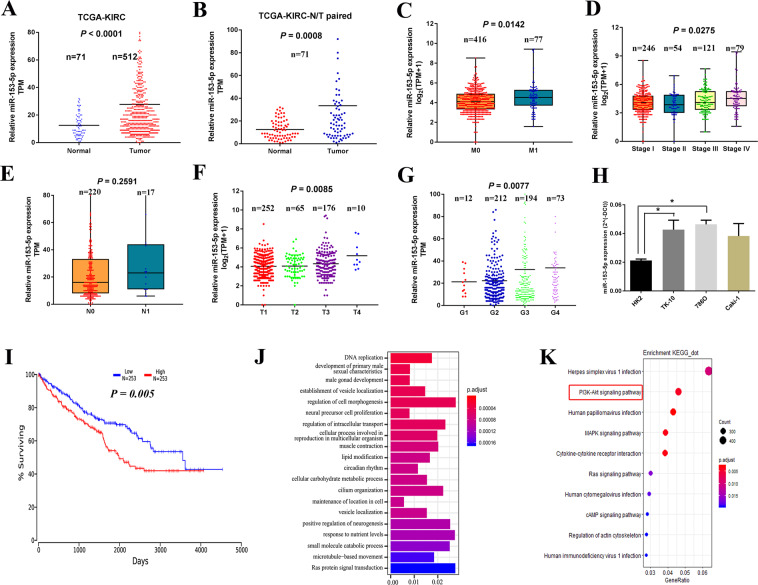
Fig. 2. MiR-153-5p is aberrantly overexpressed in ccRCC and related to unfavorable clinical features and prognosis.
A, B Relative expression of miR-153-5p in tumor-normal tissues (A) and paired tumor-normal tissues (B) of TCGA. Horizontal lines represent the mean value. C–G Correlation of miR-153-5p with clinicopathological characteristics, including metastasis (C), TNM stage (D), lymph node metastasis (E), T stage (F), and histologic grade (G). H The expression level of miR-153-5p in ccRCC cell lines and human renal tubular epithelial cells. Horizontal lines in F, G represent the mean value. Horizontal lines in the boxes in C–E indicated the median value. Boxes span the interquartile range. Whiskers extend from the minimum to the maximum. The values in H are presented as mean ± SEM. I Kaplan–Meier analysis of the correlation between miR-153-5p and overall survival in ccRCC. J, K Gene Ontology (GO) enrichment analysis (J) and Kyoto Encyclopedia of Genes Genomes (KEGG) pathways enrichment analysis (K) for the expression of miR-153-5p. All experiments were conducted at least three independent times. *P < 0.05.

