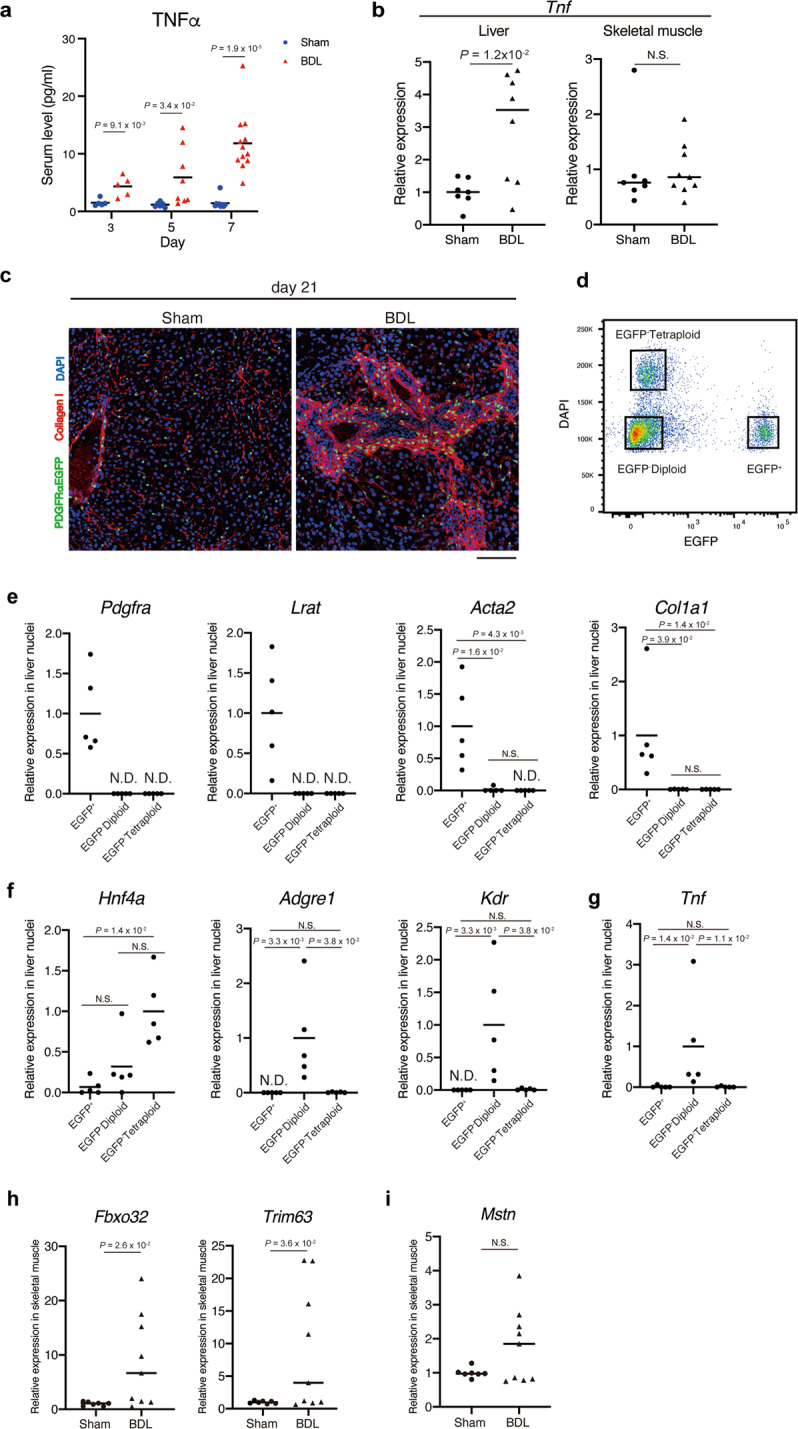
Fig. 5. Tnf expression is up-regulated in the liver but not in the skeletal muscle of BDL mice.

a Serum levels of TNFα at day 3, 5, and 7 post-operation were measured using ELISA. b The expression level of Tnf was quantified in the liver (left) and skeletal muscle (right) at day 7 post-operation. c Liver sections of PdgfrαEGFP mice at day 21 post-operation were subjected to immunofluorescence staining for collagen I and DAPI. d A representative FACS plot for nuclei isolation. Nuclei were isolated from freshly frozen fibrotic livers of PdgfrαEGFP mice using FACS. Three gates were set as indicated in the plot to isolate EGFP+, EGFP− diploid, and EGFP− tetraploid nuclei. e The expression levels of hepatic stellate cell markers (Pdgfra and Lrat) and fibrosis markers (Acta2 and Col1a1) were quantified. f The expression levels of the hepatocyte marker (Hnf4a), Kupffer cell marker (Adgre1), and endothelial cell marker (Kdr) were quantified. g Quantitative analysis of Tnf gene expression. h The expression levels of Fbxo32 and Trim63 in the skeletal muscle were quantified. i The expression levels of Mstn in the skeletal muscle were quantified. n = 5, 6, and 9 (sham) and 5, 8, and 12 (BDL) mice for day 3, 5, and 7, respectively (a), n = 7 (sham) and 8 (BDL) mice for the liver, n = 7 (sham) and 9 (BDL) mice for the skeletal muscle (b, h, i), and n = 5 mice (e–g). Data represent individual data points and the means. Data were analysed using the two-sided unpaired t-test, t-test with Welch’s correction, or Kruskal–Wallis non-parametric test followed by Dunn’s post hoc test. NS not significant, ND not detected. Scale bar, 100 μm (c).
