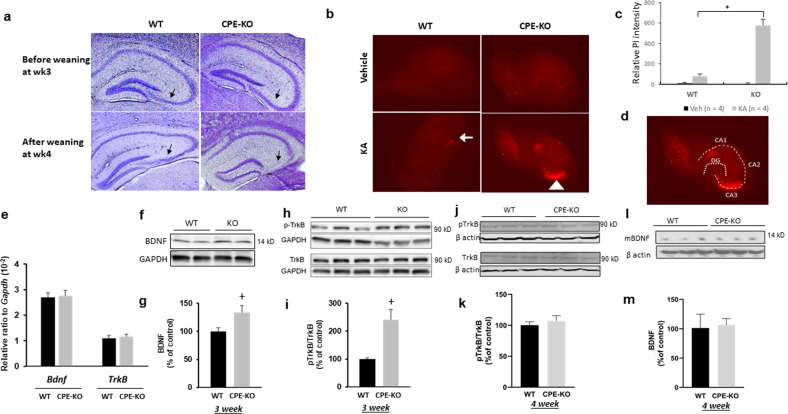
Fig. 1. The effect of weaning stress and kainic acid on neurodegeneration of hippocampal CA3 region and BDNF/TrkB expression in hippocampus of WT and CPE-KO mice.
(a) Nissl staining of coronal anterior hippocampus of WT and CPE-KO mice. CPE-KO mice displayed significant hippocampal CA3 degeneration after the weaning stress paradigm, but not before weaning. Sale bar = 100 μm. b Images of propidium iodide staining and (c) bar graphs representing the effect of kainic acid (KA) on mouse organotypic hippocampal slice culture. Note the severe cell death in the CA3 region (see arrowhead in (b)) in the CPE-KO mice compared to WT mice (see arrow). n = 4, Wilcoxon non-parametric comparison. +p = 0.02857 for KA-treated KO compared with KA-treated WT. Veh: Vehicle. KA: Kainic acid. WT: wild type. d Schematic illustration of CA1, CA2, CA3, and dentate gyrus(DG) of the hippocampus. e mRNA levels of BDNF and TrkB in the hippocampus from 3-week-old CPE-KO mice. There was no difference in expression between CPE-KO and WT mice. WT n = 6, CPE-KO n = 8. The mRNA expression level for each sample was normalized to Gapdh. f Representative western blot and (g) quantification showing levels of BDNF protein in the hippocampus of 3-week-old CPE-KO and WT mice. n = 10, Student’s t test, +p = 0.03314. Values are mean ± SEM. h Representative western blot and (i) quantification showing levels of phospho-TrkB and TrkB proteins in the hippocampus of 3-week-old CPE-KO and WT mice. n = 5. Student’s t test,+p = 0.01669, Values are mean ± SEM. j Representative Western blot and (k) quantification showing levels of phospho-TrkB and TrkB proteins in the hippocampus of 4-week-old CPE-KO and WT mice. n = 3 mice. Student’s t test, p = 0.531, values are mean ± SEM. l Representative Western blot and (m) quantification showing levels of mBDNF protein in the hippocampus of 4-week-old CPE-KO and WT mice. n = 3 mice, Student’s t test, p = 0.853, values are mean ± SEM.

