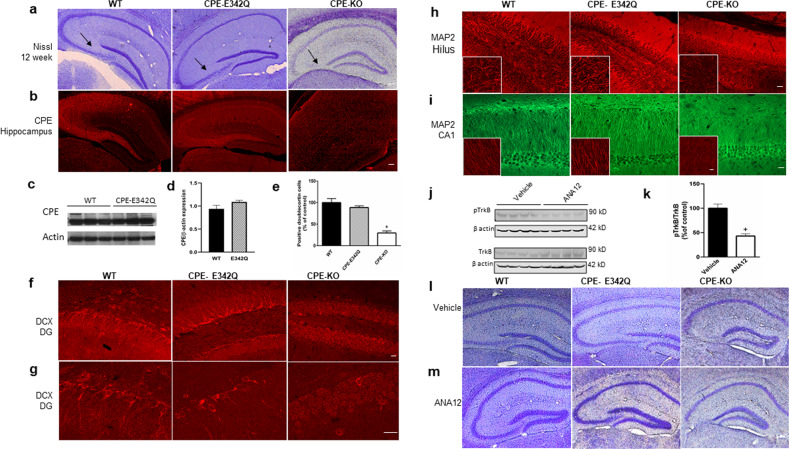
Fig. 3. CPE-E342Q mice show no hippocampal neurodegeneration after weaning stress, unlike CPE-KO mice, and this effect was not blocked by TrkB inhibitor.
a Representative sections of Nissl staining of coronal anterior hippocampus of 12-week-old WT, CPE-E342Q, and CPE-KO mice. CPE-E342Q mice showed an intact hippocampus similar to WT mice, however, CPE-KO mice exhibited complete degeneration of the CA3 region (see arrow). Scale bar=100 μm. n = 3 mice per genotype. b Immunohistochemistry of representative sections showing intense CPE staining in hippocampal CA1 and CA3 regions in WT and CPE-E342Q mice, but absence in CPE-KO mice. Sale bar=100 μm. n = 3 mice per genotype. c, d Western blot and quantification of expression of CPE in the hippocampus of WT and CPE-E342Q mice. Student’s t test, p = 0.149. n = 3 mice per genotype. Values are mean ± SEM. e Bar graphs showing % of DCX positive cells in the dentate gyrus of CPE-E342Q mice compared to WT and CPE-KO mice. Note the decreased number of DCX positive cells in CPE-KO but not CPE-342Q mice. One-way ANOVA analysis followed by Tukey’s post hoc multiple comparison test, [F(2,6) = 43.32, p = 0.0003]. +p = 0.0003 for CPE-KO mice compared with WT which was made =100%. n = 3 per each genotype. Values are mean ± SEM. f, g Representative confocal images captured at 20X and 60X, respectively, of doublecortin (DCX) immunofluorescence staining showing decreased hippocampal dentate gyrus (DG) neurogenesis in CPE-KO mice, but not in WT and CPE-E342Q mice. Scale bars in F = 20 μm and G = 20 μm. n = 3 mice per genotype. h MAP2 immunofluorescence staining images captured at 20X and 60X (left bottom insert) showing decreased MAP2 intensity in the hilus of CPE-KO mice, but not in WT and CPE-E342Q mice. n = 3 per genotype. Scale bar = 20 μm. i MAP2 immunofluorescence staining images captured at 20X and 60X (left bottom insert) showing decreased MAP2 intensity in the hippocampal CA1 region of CPE-KO mice, but not in WT and CPE-E342Q. n = 3 per genotype, Scale bar = 20 µm. j, k Western blot and bar graph of pTrkB and TrkB levels in the hippocampus of mice treated with ANA12 or vehicle. WT animal received ANA12 or vehicle treatment for 2 weeks and hippocampus was dissected to determine pTrkB/TrkB levels. Using this paradigm, ANA12 effectively decreased pTrkB/TrkB to 43.08% compared with vehicle-treated (control) mice. Student’s t test, +p = 0.001 for ANA12 treatment compared with vehicle. Values are mean ± SEM, n = 4 mice/condition. l, m The effect of TrkB inhibitor, ANA12 on hippocampal CA3 region in CPE-WT, CPE-E342Q, and CPE-KO mice after weaning stress. Representative Nissl staining of sections of coronal anterior hippocampus of WT, E342Q, and CPE-KO mice at week 4 after ANA12 treatment. All mice were toe clipped within postnatal day 7 and received ANA12 i.p injection starting from postnatal day 14 for 14 days. Mice were weaned, tail clipped, and ear tagged at 3 weeks of age and sacrificed at week 4. n = 4 mice/condition, scale bar = 100 µm.

