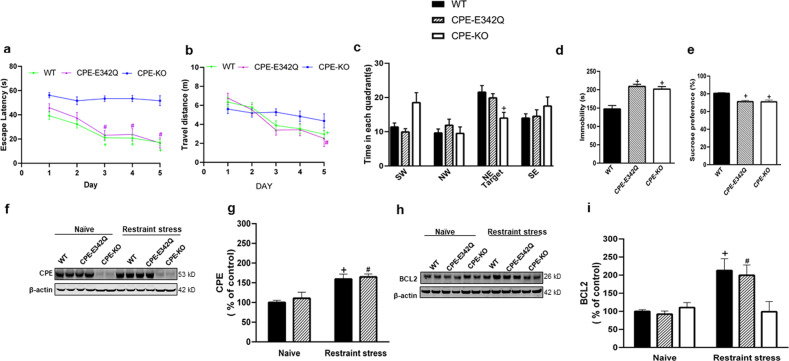
Fig. 4. CPE-E342Q mice have normal cognitive function but display depressive-like behavior and demonstrate increased CPE and BCL2 after restraint stress.
a Escape latency of WT, CPE-KO, and CPE-E342Q mice in Morris water maze test. WT and CPE-E342Q mice exhibited a normal learning acquisition curve during the 5-day test, and spatial memory; whereas CPE-KO mice demonstrated a deficit in spatial learning and memory. Two-way repeated ANOVA analysis followed by Tukey’s post hoc multiple comparison test. Day × Genotype: [F(8,180) = 2.899, p = 0.0046]; Day: [F(3.783,170.2) = 17.09, p < 0.0001]; Genotype: [F(2,45) = 46.15, p < 0.0001]. Escape latency was decreased on day 3 (+p = 0.0043), day 4 (+p = 0.0031), and day 5 (+p < 0.0001) in WT and day 3 (#p = 0.0019), day 4 (#p = 0.0173), and day 5 (#p = 0.0036) in CPE-E342Q mice compared with day 1 respectively, but not in CPE-KO mice. n = 24 for WT, n = 12 for CPE-E342Q, n = 12 for CPE-KO. Values are mean ± SEM. b Travel distance during 5-day training of the water maze test. WT and CPE-E342Q showed no significant differences in travel distance during the 5-day training, although the CPE-KO mice tended to show a longer travel distance in days 3–5 of training compared to WT mice. Two-way repeated ANOVA analysis followed by Tukey’s post hoc multiple comparison test. Day × Genotype: [F(8,180) = 1.702, p = 0.1007]; Day: [F(3.611,162.5) = 15.40, p < 0.0001]; Genotype: [F(2,45) = 1.148, p = 0.3265]. +p = 0.0004 for WT day 5 compared with day 1; #p = 0.014 for CPE-E342Q day 5 compared with day1. n = 24 for WT, n = 12 for CPE-E342Q, n = 12 for CPE-KO. Values are mean ± SEM. c Time spent in each quadrant of WT, CPE-KO, and CPE-E342Q mice in Morris water maze test. WT and CPE-E342Q mice spent more time in target quadrants than CPE-KO mice which spent about the same time in each quadrant. Two-way repeated ANOVA followed by Tukey’s post hoc multiple comparison test. Area × Genotype: [F(6,135) = 2.986, p = 0.009]; Genotype: [F(2,45) = 14.64, p < 0.0001]; Area: [F(2.474,111.3) = 8.030, p = 0.0002]. +p = 0.015 for CPE-KO compared with WT mice in NE target area. SW(Southwest), NW(Northwest), NE(Northeast), SE(Southeast). n = 24 for WT, n = 12 for CPE-E342Q, n = 12 for CPE-KO. Values are mean ± SEM. d Immobility time of WT, CPE-KO, and CPE-E342Q mice in forced-swim test. Both CPE-KO and CPE-E342Q mice displayed increased immobility in the forced-swim test, suggesting depressive-like behavior. One-way ANOVA followed by Tukey’s post hoc multiple comparison test. [F(2,45) = 15.64, p < 0.0001]. +p < 0.0001 for CPE-E342Q compared with WT; +p = 0.0003 for CPE-KO compared with WT. n = 24 for WT, n = 12 for CPE-E342Q, n = 12 for CPE-KO. Values are mean ± SEM. e Sucrose preference of WT, CPE-KO, and CPE-E342Q mice. CPE-KO and CPE-E342Q mice both displayed decreased preference for sucrose, suggesting depressive-like behavior. One-way ANOVA analysis followed by Tukey’s post hoc multiple comparison test. [F (2,45) = 18.77, p < 0.0001]. +p < 0.0001 for both CPE-E342Q and CPE-KO compared with WT. n = 24 for WT, n = 12 for CPE-E342Q, n = 12 for CPE-KO. Values are mean ± SEM. f Representative Western blot of CPE in WT, CPE-E342Q, and CPE-KO (which showed no expression of CPE) and (g) quantification showing CPE protein level in the hippocampus of WT, and CPE-E342Q mice subjected to chronic restraint stress. Two-way ANOVA analysis followed by Tukey’s post hoc multiple comparison test. Genotype × Restraint stress: [F(1,12) = 0.0566, p = 0.816]; Restraint stress: [F(1,12) = 27.81, p = 0.0002]; Genotype: [F(1,12) = 0.5668, p = 0.4660]. +p = 0.01 for restraint stressed WT compared with naïve WT; #p = 0.018 for restraint stressed CPE-E342Q, compared with naïve CPE-E342Q. n = 4 mice, values are mean ± SEM. h Representative western blot and (i) quantification showing BCL2 protein level in the hippocampus of WT, CPE-E342Q, and CPE-KO mice challenged to chronic restraint stress. Two-way ANOVA analysis followed by Tukey’s post hoc multiple comparison test. Genotype × Restraint stress: [F(2,18) = 5.019, p = 0.0185]; Restraint stress: [F(1,18) = 14.74, p = 0.0012]; Genotype: [F(2,18) = 3.047, p = 0.0725]. +p = 0.022 for restraint stressed WT compared with naïve WT; #p = 0.031 for restraint stressed CPE-E342Q compared with naïve CPE-E342Q. n = 4 mice, values are mean ± SEM.

