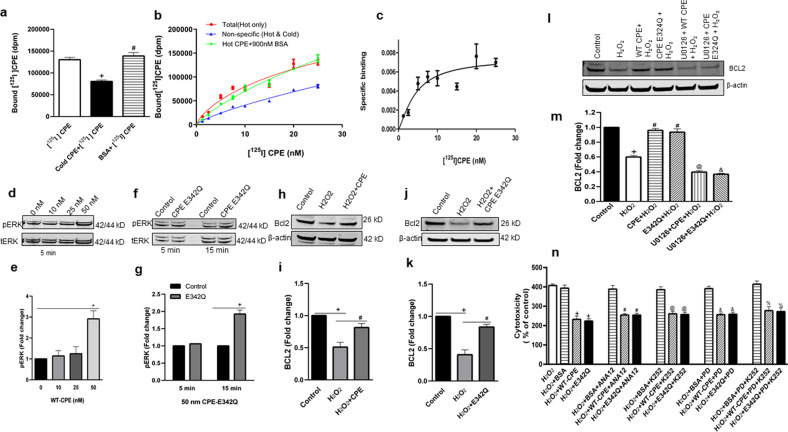
Fig. 5. CPE binds to cell surface membrane and activates ERK-BCL2 signaling cascade, and its neuroprotective effect is tyrosine kinase independent.
a [125I] CPE binds specifically to HT22 cell surface. HT22 cells were incubated with 25 nM [125I] radio-labeled CPE (hot) for 3 h on ice in serum-free binding medium. To demonstrate binding specificity, 900 nM non-radio-labeled CPE (cold) or bovine serum albumin (BSA) was co-incubated with hot CPE to compete and displace the hot CPE binding. The bar graphs show that the [125I] CPE binding to HT22 cell surface membrane was displaced by cold CPE but not by BSA. One-way ANOVA followed by Tukey’s post hoc multiple comparison test, [F(2,6) = 29.11, p = 0.0008]. +p = 0.002 for cold CPE + [125I] CPE compared with [125I] CPE (hot) treatment; #p = 0.001 for BSA + [125I] CPE compared with CPE (cold)+ [125I] CPE treatment. The experiment was run in triplicates, values are mean ± SEM. b [125I] CPE binds HT22 cell surface in a saturated manner. HT22 cells were incubated with different concentrations (1.25–25 nM) of [125I] CPE (hot) with or without 900 nM cold CPE for 3 h on ice in serum-free binding medium. The non-specific binding was determined by measuring bound [125I] CPE in the presence of excess non-radio-labeled CPE (cold) with the [125I] CPE. Note that BSA did not displace total [125I] CPE binding. c Graph shows specific binding obtained by subtracting non-specific binding from total [125I] CPE binding. d–g CPE and CPE-E342Q activate ERK signaling in HT22cpe−/− neuronal cells. d HT22 cpe−/− cells were treated with 0, 10, 25, and 50 nM WT-CPE for 5 min and pERK 1/2 were analyzed by western blotting. e Bar graphs showing the fold change in phosphorylation of ERK1/2 which was determined by normalization using tERK1/2 as an internal control. One-way ANOVA analysis followed by Tukey’s post hoc multiple comparison test, [F(3, 8) = 9.830, p = 0.0046]. +p = 0.0065 for 50 nM WT-CPE compared with control at 0 nM concentration. N = 3, values are mean ± SEM. f HT22 cpe−/− cells were treated with 50 nM CPE-E342Q for 5 min and 15 min and pERK 1/2 were analyzed by western blotting. g Bar graphs showing the fold change in phosphorylation of ERK1/2 which was determined by normalization using tERK1/2 as an internal control. One-way ANOVA analysis followed by Tukey’s post hoc multiple comparison test, [F(3,8)=61.33, p < 0.0001]. +p < 0.0001 for CPE-E342Q treatment compared with control at 15 min. N = 3, values are mean ± SEM. h–k CPE and CPE-E342Q protect HT22cpe−/− cells against oxidative stress by regulating BCL2 level. h, j Western blot analysis of BCL2 protein in HT22cpe−/− cells which were treated with CPE-WT or CPE-E342Q respectively for 6 h followed by 100 μM H2O2 for 18–24 h. i, k Bar graphs showing quantification of BCL2 protein after normalization with β-actin which was used as a loading control. Results are expressed as fold change as compared to untreated controls. Similar to WT-CPE protein, CPE-E342Q was also able to prevent the H2O2 induced decrease in BCL2 level. For CPE-WT(i): one-way ANOVA analysis followed by Tukey’s post hoc multiple comparison test, [F(2, 6) =19.37, p = 0.0024]. +p = 0.002 for H2O2 compared to untreated control, #p = 0.0201 for H2O2 + CPE compared to H2O2 treatment. N = 3, values are mean ± SEM. For CPE-E342Q (k): one-way ANOVA analysis followed by Tukey’s post hoc multiple comparison test, [F(2, 6) = 38.69, p = 0.0004]. +p = 0.0004 for H2O2 treatment compared to control, #p = 0.002 for H2O2 + E342Q compared to H2O2 treatment. N = 3, values are mean ± SEM. l, m Effect of ERK inhibitor on CPE induced BCL2 expression. l Western blot analysis of BCL2 protein in HT22cpe−/− cells which were treated with or without 5 μM MEK 1/2 inhibitor, U0126 for 30 min followed by treatment with 50 nM WT or E342Q recombinant CPE for 6 h. Cells were then treated with 100 μM H2O2 for the next 24 h. m Bar graphs showing quantification of BCL2 protein after normalization with β-actin which was used as a loading control. Results are expressed as fold decrease as compared to untreated controls. One-way ANOVA analysis followed by Tukey’s post hoc multiple comparison test, [F(5,12) = 138.6, p < 0.0001]. +p < 0.0001 for H2O2 compared to control, #p < 0.0001 for both CPE + H2O2 and E342Q + H2O2 compared with H2O2 treatment, @p < 0.0001 for U0126 + CPE + H2O2 compared with CPE + H2O2 treatment, &p < 0.0001 for U0126 + E342Q + H2O2 compared with E342Q + H2O2 treatment. N = 3, values are mean ± SEM. n Neuroprotective effect of WT-CPE and CPE-E342Q against H2O2-induced cytotoxicity in mouse primary hippocampal neurons is independent of Trk receptor signaling. Bar graphs show that, 1 µM of Trk inhibitor, K-252a, or 100 µM of ANA12, a specific TrkB inhibitor, or 1 µM of FGFR1,2,3 inhibitor, PD166285 did not inhibit the neuroprotective effect of CPE and CPE-E342Q against H2O2-induced cytotoxicity assessed by LDH assay. One-way ANOVA analysis followed by Tukey’s post hoc multiple comparison test, [F(15,32) = 26.93, p < 0.0001]. +p < 0.0001 for H2O2 + WT-CPE and H2O2 + E342Q compared with H2O2 + BSA; #p < 0.0001 for H2O2 + WT-CPE + ANA12 and H2O2 + E342Q + ANA12 compared with H2O2 + BSA + ANA12; @p < 0.0001 for H2O2 + WT-CPE + K252 and H2O2 + E342Q + K252 compared with H2O2 + BSA + K252; &p < 0.0001 for H2O2 + WT-CPE + PD and H2O2 + E342Q + PD compared with H2O2 + BSA + PD; %p < 0.0001 for H2O2 + WT-CPE + PD + K252 and H2O2 + E342Q + PD + K252 compared with H2O2 + BSA + PD + K252 treatment. N = 3 independent experiments which were run in triplicate, values are mean ± SEM.

