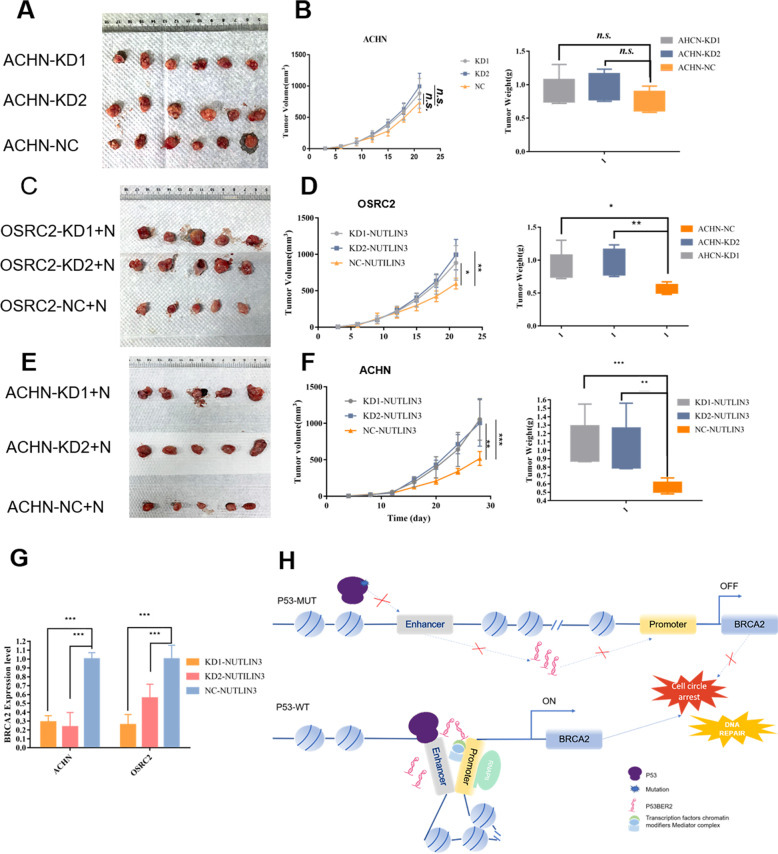
Fig. 6. Downregulation of P53BER2 shows resistance to nutlin-3 treatment in cell-derived xenografts (CDXs).
A Image of 18 xenografts formed by ACHN-KD1, KD2, and Control. B Growth curves of mice subcutaneous xenografts derived from ACHN-KD1, KD2, and Control cells (left panel). Tumor weights were statistically analyzed (right panel). C Image of 15 xenografts formed by OSRC-2-KD1, KD2, and Control with nutlin-3 treatment. D Growth curves of mice subcutaneous xenografts derived from OSRC-2-KD1, KD2, and Control cells with nutlin-3 treatment (left panel). Tumor weights were statistically analyzed (right panel). E Image of 15 xenografts formed by ACHN-KD1, KD2, and Control with nutlin-3 treatment. F Growth curves of mice subcutaneous xenografts derived from ACHN-KD1, KD2, and Control cells with nutlin-3 treatment (left panel). Tumor weights were statistical analyzed (right panel). G BRCA2 expression in mice subcutaneous xenograft. Results are shown as mean ± SD. ***P < 0.001 compared with control. **P < 0.01 compared with control. *P < 0.05 compared with control. H Schematic model of P53BER2-dependent regulation of P53 activity in p53-MUT or TP53-WT condition.

