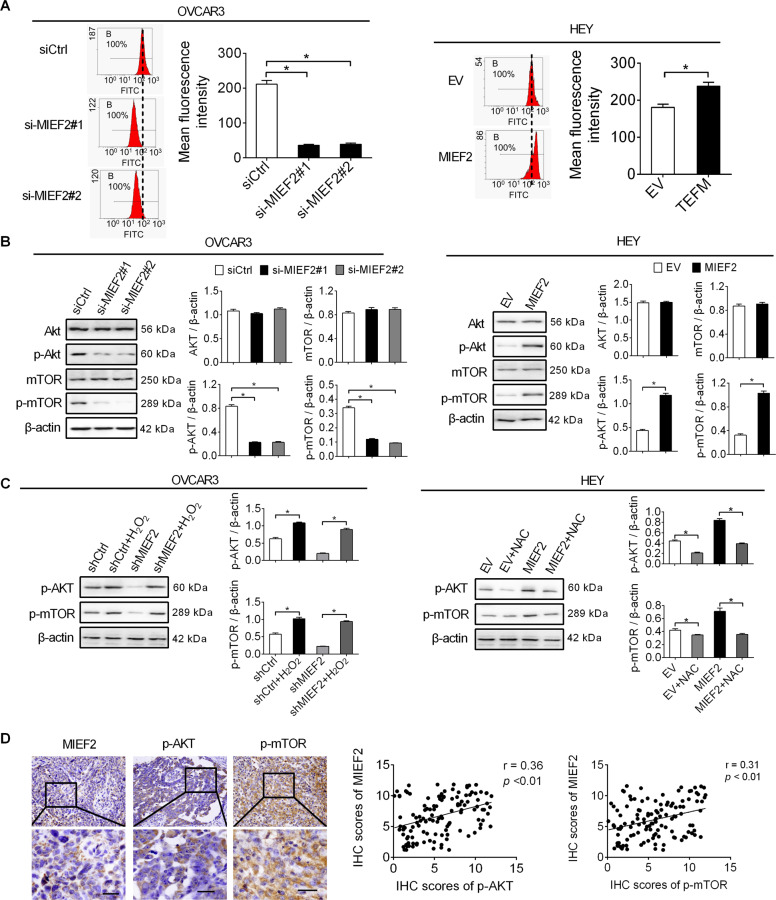
Fig. 5. MIEF2 activated ROS/AKT/mTOR signaling in OC cells.
a Intracellular ROS level was determined by flow cytometry in OVCAR3 and HEY cells with MIEF2 knocked-down or over-expressed (N = 3). b Western blot analysis for AKT, p-AKT, mTOR and p-mTOR in OVCAR3 and HEY cells with MIEF2 knocked-down or over-expressed (N = 3). c Western blot analysis for p-AKT and p-mTOR in OVCAR3 cells treated with 90 μM H2O2 for 12 h as indicated (N = 3). d Left panel: representative immunohistochemical (IHC) staining of MIEF2, p-AKT and p-mTOR in tumor tissues of OC. Scale bars, 50 μm. Right panel: Spearman correlation analysis of the relationship between the protein expression levels of MIEF2 and p-AKT and p-mTOR in tumor tissues from 122 OC patients.

