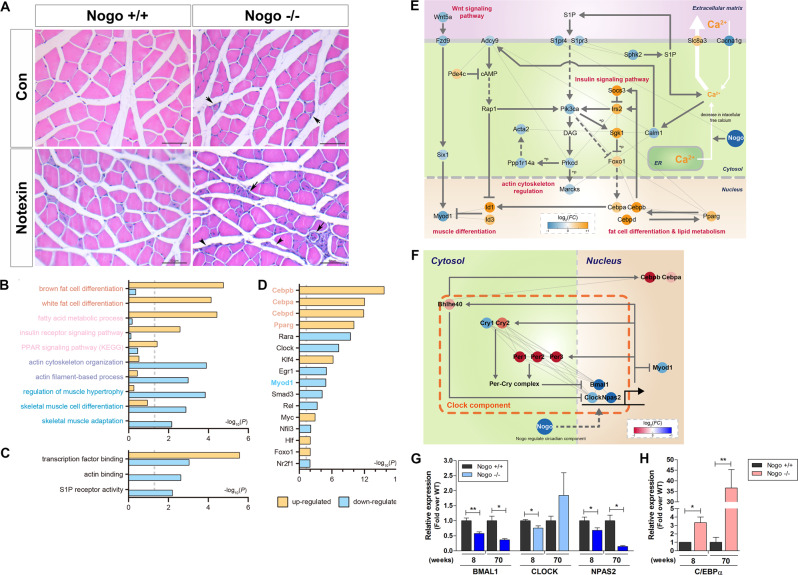
Fig. 3. Cellular processes affected by Nogo deficiency, and muscle physiology of notexin-induced Nogo−/− mice.
A Representative images of hematoxylin/eosin stained non-injured control (Con, n = 5) and notexin-injured (500 ng/gastrocnemius, n = 5) muscles from Nogo+/+ or Nogo−/− mice. Short and long arrows indicate defective and regenerating myofibers, respectively. Arrowheads mark fibrotic cells. Scale bar = 50 µm. Gene Ontology biological processes (GOBPs) (B) and gene Ontology molecular functions (GOMFs) (C) represented by genes up- and downregulated by Nogo knockout. Enrichment significance was determined via p-values calculated with DAVID is displayed as −log10(P). P-values for up- and downregulated GOBPs or GOMFs are denoted using orange or light blue bars, respectively. p < 0.05. D Major transcription factors (TFs) that regulate a high number of differentially regulated genes (DEGs). Four upregulated TFs and one downregulated TF in Nogo−/− mice are labeled in orange and light blue, respectively. E Model network describing potential roles of Nogo in the regulation of myogenesis. Node colors represent upregulation (orange) and downregulation (blue) of the corresponding genes by the Nogo knockout. Arrows and suppression symbols denote activation and inhibition, respectively, based on the KEGG pathway database. Solid and dotted lines represent direct and indirect reactions, respectively, and gray lines represent protein–protein interactions between the connected nodes. The color bar represents gradient of log2 fold changes, log2(FC), between the Nogo−/− and WT muscle tissues. F Network model for circadian rhythm regulation in Nogo−/− mouse. Node colors represent upregulation (red) and downregulation (blue) of the corresponding genes by Nogo knockout. Arrows and suppression symbols denote activation and inhibition, respectively, based on the KEGG pathway database. Solid and dotted lines represent direct and indirect reactions, respectively, and gray lines represent protein–protein interactions between the connected nodes. The color bar represents gradient of log2(FC) between the Nogo−/− and WT muscle tissues. G, H qRT-PCR analysis for indicated genes in muscle samples from 8- and 70-week-old Nogo+/+ (n = 4) and Nogo−/− (n = 3) mice. Mean ± SEM. *p < 0.05, **p < 0.01.

