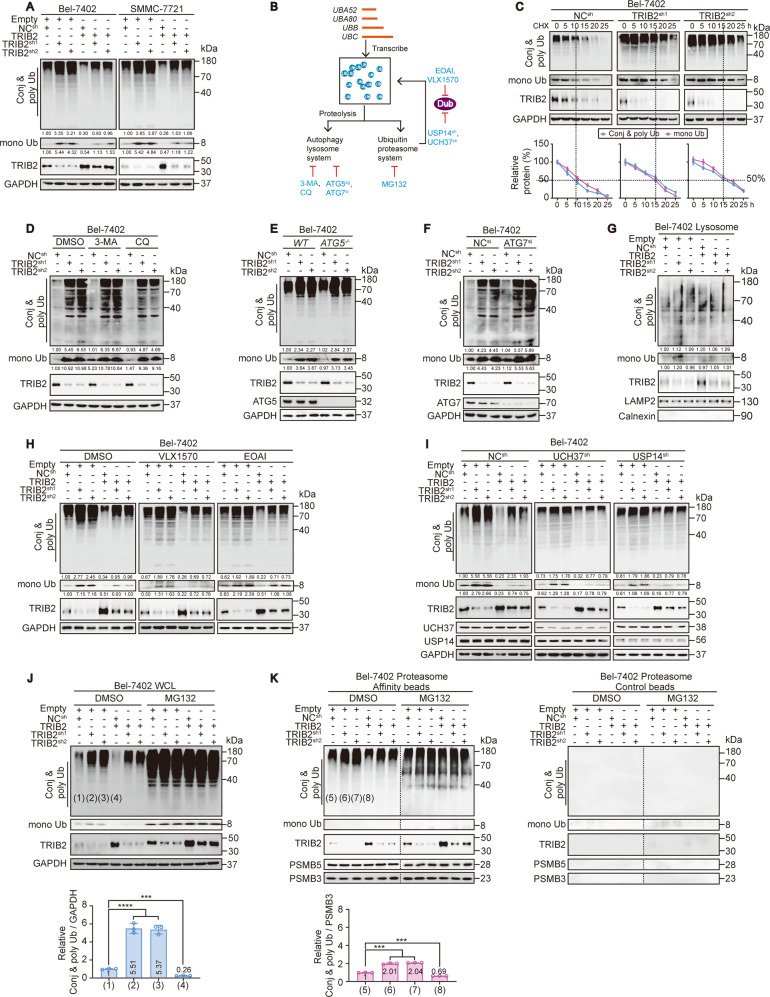
Fig. 1. TRIB2 regulates Ub levels via the proteasome.
a Ub in the control, Bel-7402 and SMMC-7721 cells with TRIB2 knocked down or overexpressed. b Schematic representation of Ub homeostasis. c CHX chase experiments of Ub in the control and Bel-7402 cells with TRIB2 knocked down. The relative protein levels of conj & poly and mono Ub were normalized to those of GAPDH, respectively, and the “0 h” point was arbitrarily set to 100%. d–f ALP did not participate in the regulation of Ub levels by TRIB2. Ub in the Bel-7402 cells with or without TRIB2 knocked down after treatment with the ALP inhibitors 3-MA (5 mM for 24 h) and CQ (20 µM, 24 h) (d), ATG5 knockout (e), or ATG7 knockdown (f). g Ub in the lysosomes isolated from the same cells as shown in a, as measured by IB. The relative protein levels of conj & poly Ub and mono Ub were normalized to those of LAMP2 as calculated by ImageJ software and indicated just below the blots. h, i TRIB2 did not regulate Ub levels through DUBs. Control and Bel-7402 cells with or without TRIB2 knocked down or overexpressed were treated with DMSO, VLX1570 (20 µM, 24 h), and EOAI (600 nM, 24 h), respectively (h), or in the presence or absence of UCH37 and USP14 knocked down (i). j, k TRIB2 regulated Ub levels via the proteasome. Ub levels at WCL (j) and in proteasome (k) were measured in the same cells shown in a and treated with DMSO or MG132 (8 µM, 12 h). The samples in k derive from the same experiment and the blots have been processed in parallel using control beads. The levels of conj & poly Ub were normalized to that of GAPDH at WCL (j), while normalized to that of PSMB3 in the isolated proteasome (k), and the data are graphed below the blots. Data were analyzed by one-way ANOVA and expressed as mean ± SD. ***P < 0.001; ****P < 0.0001. Images of all the immunoblots are representative of three independent experiments. The relative protein levels of the conj & poly Ub and mono Ub were normalized to those of GAPDH as calculated by ImageJ software and indicated just below the blots (a, d–f, h, i).

