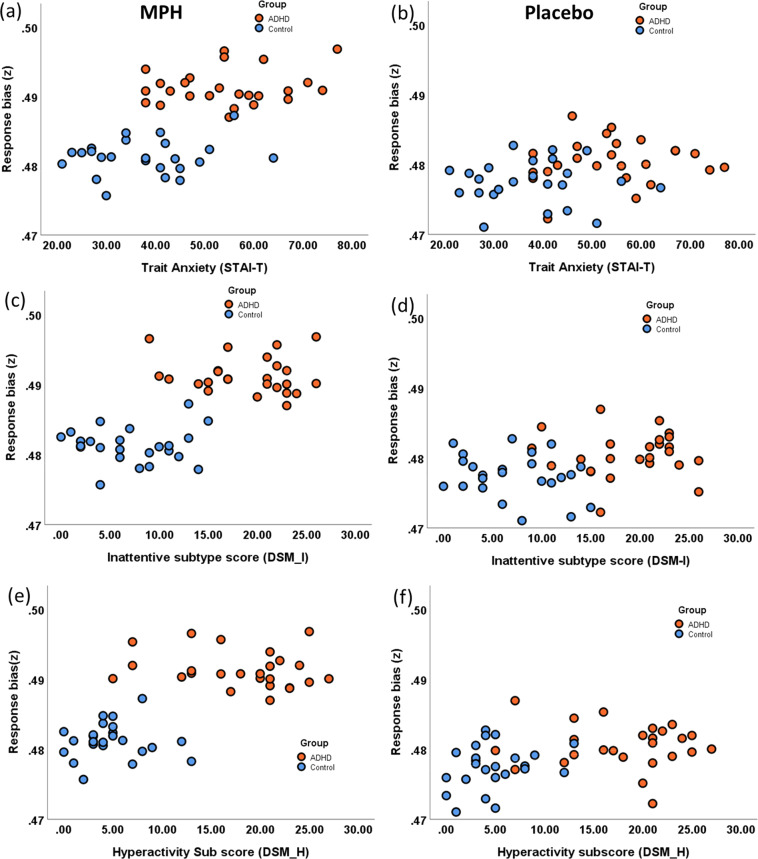
Fig. 3. Relationship between clinical scores and the response bias (z) parameter of the hierarchical drift diffusion model.
Shows the scatter plot between response bias (z) and anxiety, inattention and hyperactivity scores in methylphenidate and placebo conditions in patient (orange) and healthy control (blue) groups (a) and (b) show the correlation between the anxiety score (STAI-trait) and response bias in placebo and drug respectively. c, d correlation between response bias and clinical inattention sub-type score (DSM-I) and (e) and (f) correlation between response bias and clinical hyperactivity sub-type score (DSM-H) in placebo and drug conditions.

