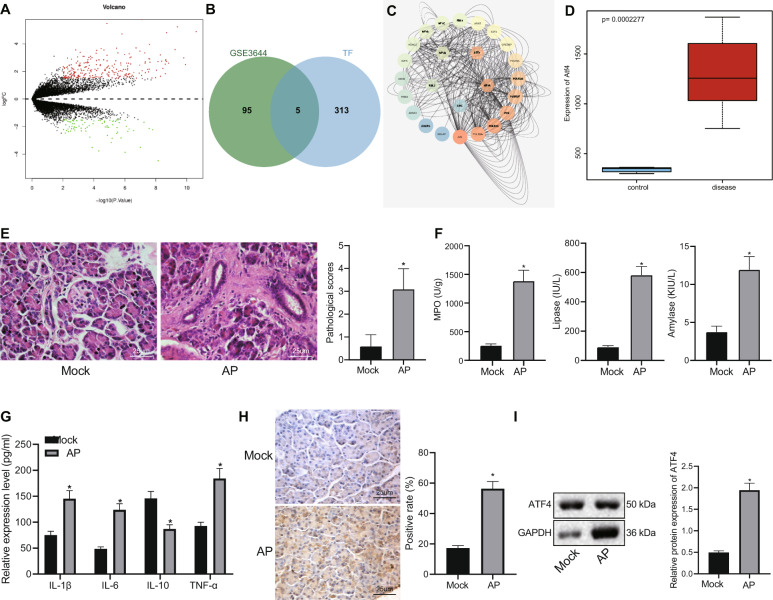
Fig. 1. Highly expressed ATF4 is found in AP.
A Volcano map of differentially expressed genes obtained by the difference analysis of microarray dataset GSE3644. Red dots indicate genes that are significantly upregulated, green dots indicate genes that are significantly downregulated, and black dots indicate insignificant genes. B Comparison results of differentially expressed genes in microarray dataset GSE3644 with transcription factors. The five intersecting genes are ATF4, HIF1A, NFYB, RBL2, and SRC. C The PPI network of important transcription factors and related genes constructed by GeneMANIA. The five hexagonal genes placed in the middle are the input genes, and the rounded genes are the predicted related genes. The higher the core level, the bluer the lower the core level. D Box line diagram (p = 2.28e−04) of ATF4 expression data in microarray dataset GSE3644. The blue box on the left indicates the expression of normal samples, and the red box on the right indicates the expression of the pancreatitis sample. E H&E staining to detect pathological conditions of pancreatic tissue. F Biochemical analysis to detect peroxidase, serum amylase, and serum lipase levels. G ELISA to detect serum IL-1β, IL-6, IL-10, and TNF-α. H ATF4 expression in pancreatic tissues detected by immunohistochemistry. I ATF4 expression in pancreatic tissue detected by western blot analysis. *p < 0.05 compared with the Mock group (normal control). The comparison of the measurement data (mean standard ± deviation) between two groups were tested by independent sample t-test, n = 12.

