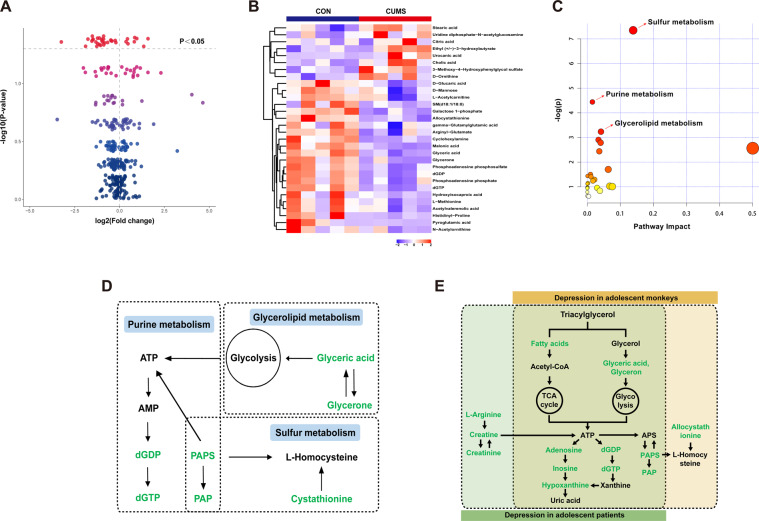
Fig. 5. Plasma metabolomics analysis in CUMS and CON groups.
A The volcano plot for the differential metabolites in CUMS and CON groups; red nodes = P < 0.05. B The heat plot for the differential metabolites in CUMS and CON groups. C The pathway analysis of differential metabolites of CUMS and CON groups in MetaboAnalyst; red nodes = P < 0.05. D A simplified interaction diagram of the altered pathways in CUMS and CON groups. Metabolites in green decreased. E A simplified interaction diagram of altered pathways between adolescent depression monkeys and patients. Metabolites in green decreased.

