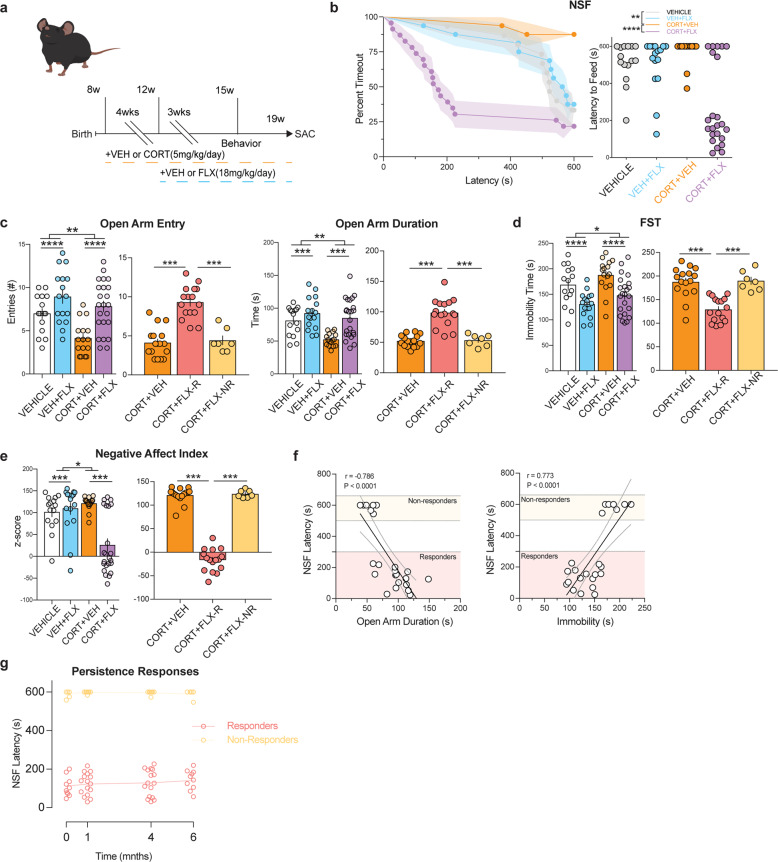
Fig. 1. Behavioral responders and non-responders to FLX treatment following CORT administration.
a Timeline of experiment. b Kaplan–Meier survival curve (left) and scatterplot (right) of NSF data showing individual latency to eat values across all four groups. c–e Left panels represent Two-way ANOVA of all treatment groups and right panels represent One-Way ANOVA of CORT+VEH, CORT+FLX responders, and CORT+FLX non-responders for: EPM open arm entries and open arm duration (c), FST immobility (d), and Negative Affect Index (e). f Regression analyses correlating NSF latency to eat with EPM open arm duration (left) and FST immobility (right). g In a separate cohort of CORT+FLX mice, persistence of response was determined by assessing NSF behavior after 3 weeks of FLX (time point 0), and then again 1, 4, and 6 months later. For the NSF survival curve, line shading shows SEM of each group (n = 15–23 per group). Scatterplots, horizontal lines, and bars show group means with error bars indicating SEM (n = 7–16 per group after CORT+FLX mice are divided into responders and non-responders).

