Figure 2.

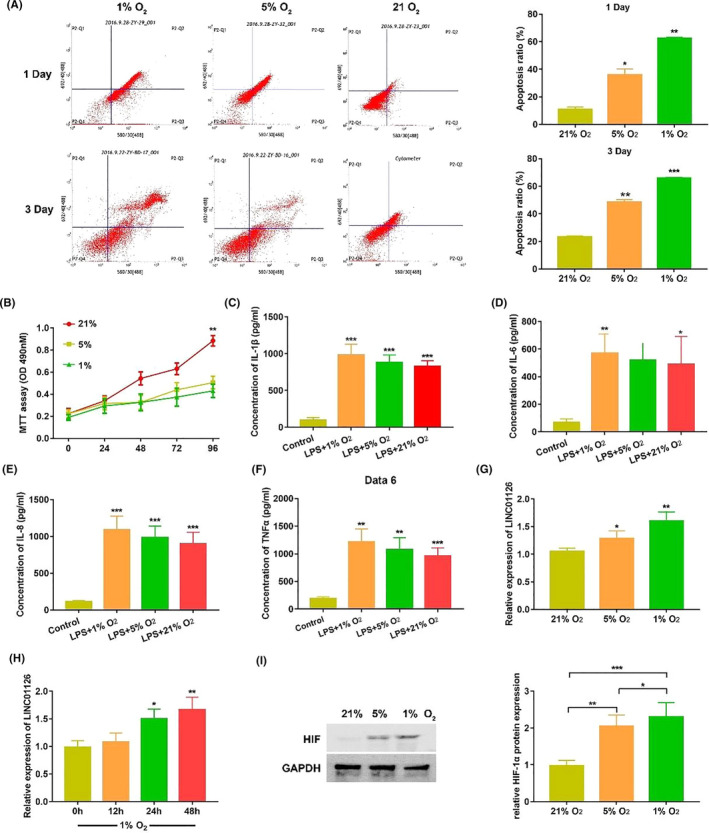
LINC01126 was upregulated in hypoxia‐induced hPDLCs. (A) Cell apoptosis ratio under hypoxia or normoxia at 1st day and 3rd day was determined by flow cytometry. (B) Cell proliferative ability at different time points under hypoxia or normoxia was determined by MTT assay. (C‐F) The secretion of inflammatory cytokines including IL‐1β IL‐6, IL‐8 and TNF‐α at different O2 concentrations after 24 h treatment was determined by ELISA. (G) The expression of LINC01126 at different O2 concentrations for 48 h was determined by qRT‐PCR. (H) The expression of LINC01126 at different time point under 1% O2 concentration condition by qRT‐PCR. (I)The protein expression of HIF‐1α after 24h treatment at different O2 concentrations by Western blot. Histogram shows quantification of the band intensities. Results are presented as mean ± SD (*p < 0.05, **p < 0.01, *** p < 0.001, compared with the control group)
