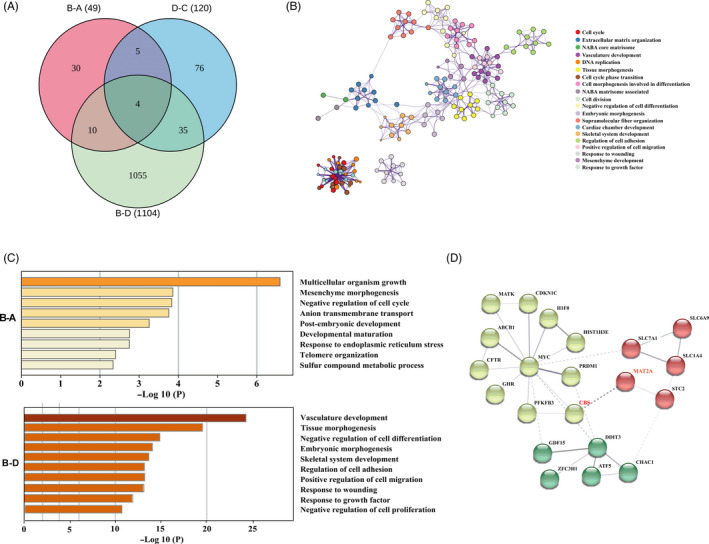
FIGURE 5.

Methionine levels modulated the transcriptome of pTr cells. A, Venn diagram comparing unique or common transcripts among the methionine treatment group, CBS silencing group and methionine‐free group. B, A network plot showing the subset of enriched terms. Terms with the best P‐values from each of the 20 clusters were selected, with the constraint no more than 10 terms per cluster. C, Metascape bar graph showing the top non‐redundant enriched clusters. D, Protein interaction network based on selected differentially expressed genes. n = 3. A: methionine‐free group; B: methionine treatment group; C: CBS−/−, − methionine; D: CBS−/−, + methionine
