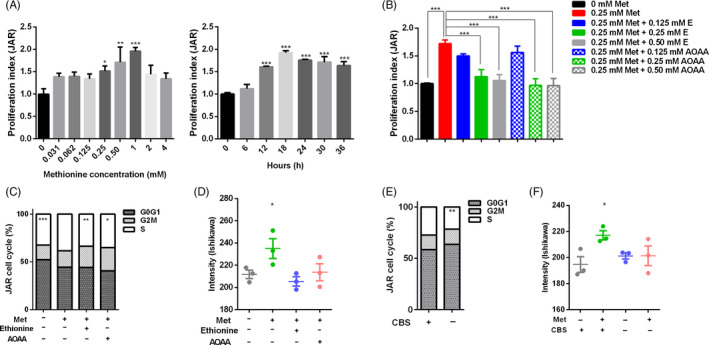
FIGURE 7.

Methionine levels impacted cell proliferation in JAR, Ishikawa and pTr cells. A, JAR cells were starved overnight in serum and methionine‐free medium and then treated with different doses of methionine for 12 h. The proliferation index was detected by the CCK‐8 method. After that, JAR cells during different durations were treated with the optimal methionine concentration, according to the cell proliferation index. B, JAR cells were treated with methionine, ethionine and AOAA. The proliferation index was detected by CCK‐8 analysis. C, JAR cells were treated with methionine, ethionine and AOAA. Cells were collected for flow cytometry assays. D, Ishikawa cells were treated with methionine, ethionine and AOAA. Cells were collected to detect DNA synthesis. E, CBS was silenced in JAR cells and treated with methionine. Cells were collected for flow cytometry assays. F, CBS was silenced in Ishikawa cells and treated with methionine. Cells were collected to detect DNA synthesis. n = 3. ***P < .001; **P < .01; *P < .05
