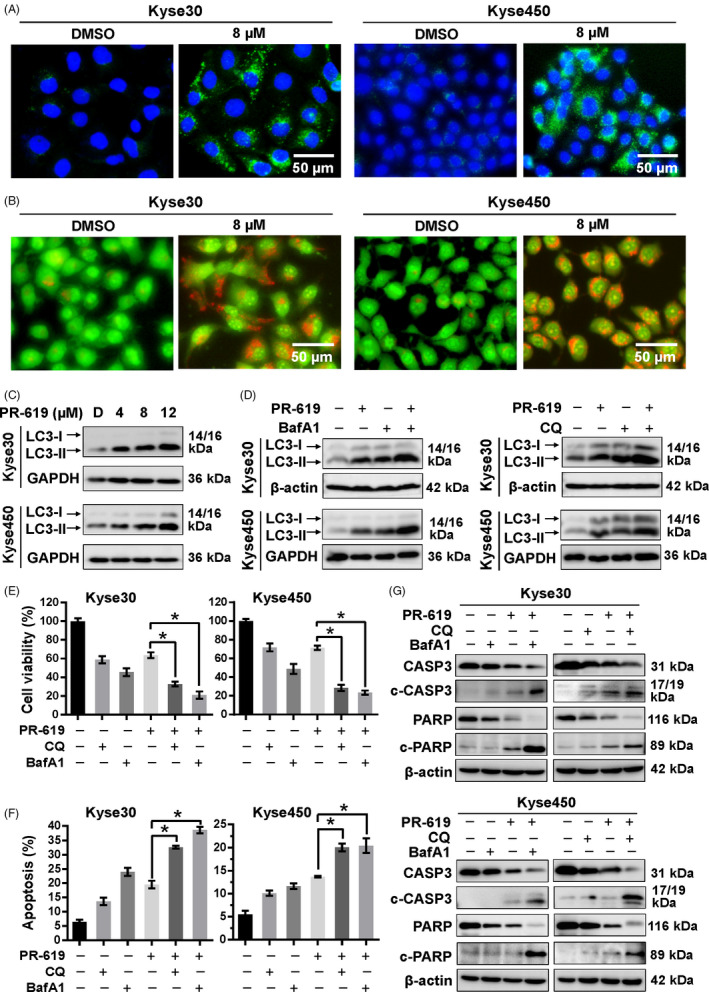
FIGURE 4.

PR‐619 treatment activated autophagy. A, Immunofluorescence of LC3. Kyse30 and Kyse450 cells were treated with PR‐619 (8 μΜ) for 24 h. Cells were then incubated with LC3 primary antibody (1:200, overnight at 4℃) and Alexa Fluor® 488 Goat Anti‐Rabbit IgG (H + L) secondary antibody (green) (1:500, 2 h at room temperature), respectively. The nuclei were stained by DAPI (blue) (5 μg/mL, 20 min at room temperature). Images were captured using fluorescence microscopy (magnification: 200×). Representative images were shown. B, AO staining after PR‐619 treatment. Kyse30 and Kyse450 cells were treated with PR‐619 for 24 h and then stained with AO. The formation of acidic vesicular organelles (AVOs) was examined under fluorescence microscopy. AVOs, such as autolysosomes, were orange/red. Non‐AVO areas (cytoplasm, nucleus, and nucleolus) were green. C, Detection of the expression of LC3. Kyse30 and Kyse450 cells were treated with PR‐619, and cell extracts were prepared for Western blotting analysis. GAPDH was used as the loading control. D, Treatment with CQ or BafA1 suppress LC3‐II degradation. Kyse30 and Kyse450 cells were treated with 8 μmol/L PR‐619 alone or in combination with CQ (12 μmol/L) or BafA1 (8 nmol/L). Cell lysates were analysed by immunoblotting with antibody against LC3. Tubulin was used as the loading control. E, Blockage of autophagy enhances PR‐619‐induced cell growth suppression of oesophageal cancer cell. Kyse30 and Kyse450 cells were treated with 8 μmol/L PR‐619 alone or in combination with CQ (8 μmol/L) or BafA1 (3 nmol/L). Cell viability was measured using the CCK‐8 assay. F and G, Blockage of the autophagic response increased PR‐619‐induced apoptosis of oesophageal cancer cells. Kyse30 and Kyse450 cells were treated with 8 μmol/L PR‐619 alone or in combination with CQ (12 μmol/L) or BafA1 (8 nmol/L). Apoptosis was determined by the Annexin V‐FITC/PI double‐staining analysis (F). Total PARP and caspase 3 and cleaved PARP and caspase 3 were detected by immunoblotting (G). β‐actin was used as the loading control. All data were representative of at least three independent experiments (n = 3; error bar, SD)
