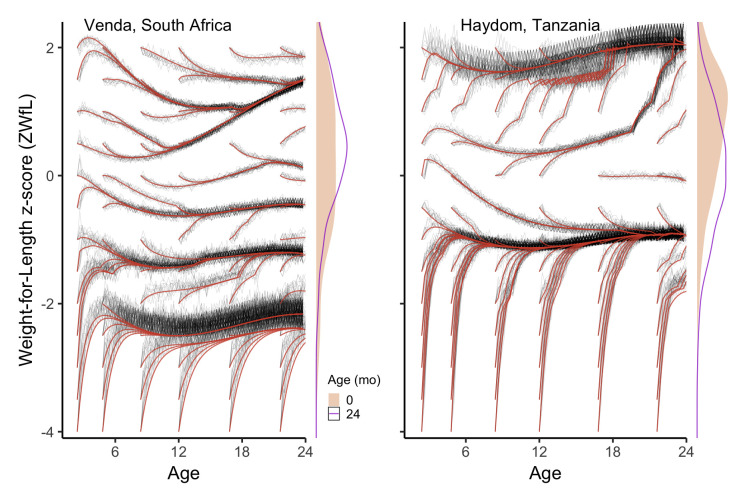
Figure 4. Predicted future weight-for-length trajectories from a grid of starting points using an SDE model.
The best-fitting predictions are shown in red and 10-fold cross validation in grey. The distributions of observed weight-for-length at both zero and 24 months in each site is shown to the right of the respective plot. The predictions appear to cluster together into a smaller set of “paths”, which also differ between sites.

