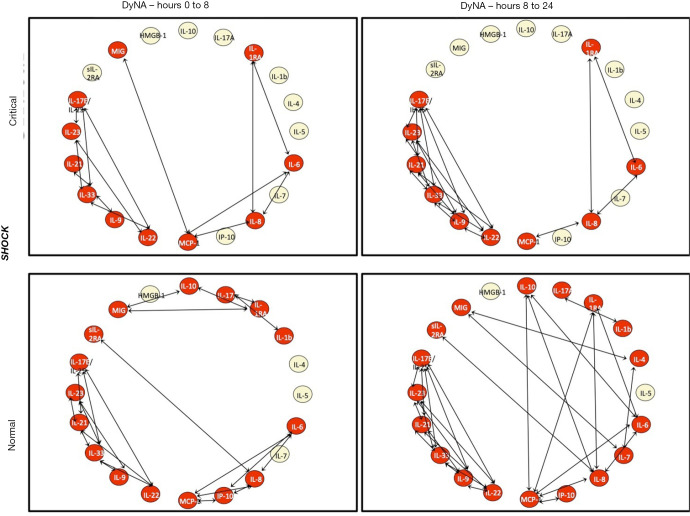
Figure 4.
Dynamic network analysis (DyNA) demonstrating inflammatory coordination for the Shock subgroup analysis (matched for age, gender, ISS and admission base deficit). The top row represents CRITICAL patients at two time intervals (0–8 and 8–24 hours), while the bottom row represents normal patient over the same interval. Inflammatory mediators are nodes, with red nodes dynamically involved in interactions, represented by the arrows. DyNa, Dynamic Network Analysis; IL-10, Interleukin 10; IL-6, Interleukin 6; MCP-1, Monocyte Chemoattractant Protein 1; HMGB-1, High Mobility Group Box 1; IL17E/IL-25, Interleukin 17E/Interleukin 25; IL-1RA, Interleukin 1 Receptor Antagonist; MIG, Monokine Induced by Gamma Interferon; IP-10, Interferon γ-induced Protein 10; IL-8, Interleukin 8; sIL-2RA, Soluble Interleukin 2 Receptor α; IL-22, Interleukin 22; IL 23, Interleukin 23; IL-33, Interleukin 33; IL-17A, Interleukin 17A; IL-21, Interleukin 21; IL-7, Interleukin 7; IL-9, Interleukin 9; IL 1b, Interleukin 1β; IL-5, Interleukin 5; IL 4, Interleukin 4.

