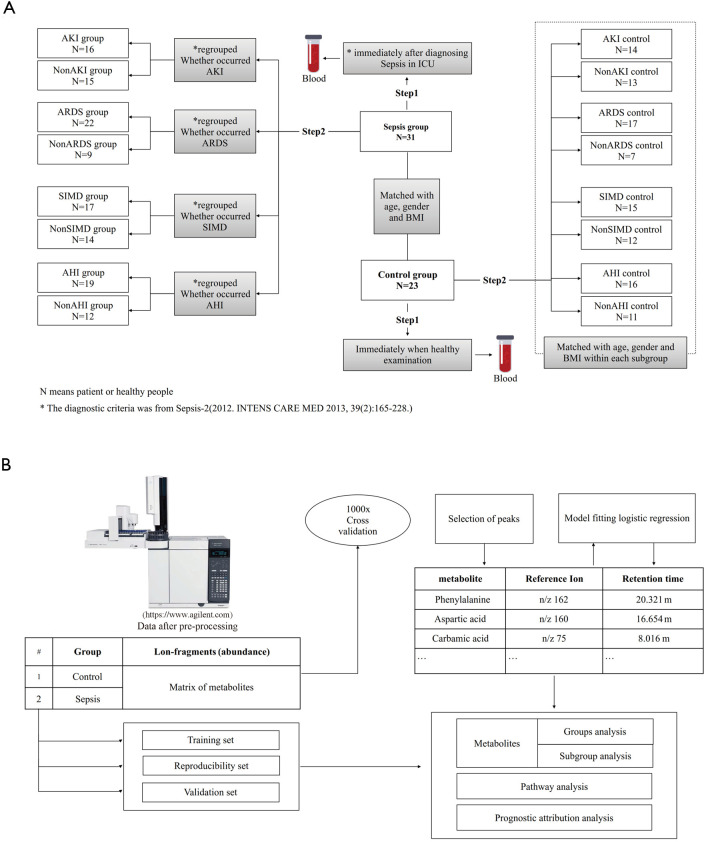
Figure 1.
Flow chart of study and GC–MS analysis. (A) Flow chart of our study; this study consisted of two steps: (I) the comparison between septic patients and healthy controls; (II) subgroup analysis, with septic patients being divided into AKI and non-AKI, ARDS and non-ARDS, SIMD and non-SIMD, and AHI and non-AHI subgroups. (B) Flow chart of GC–MS plasma analysis of sepsis patients and healthy controls.

