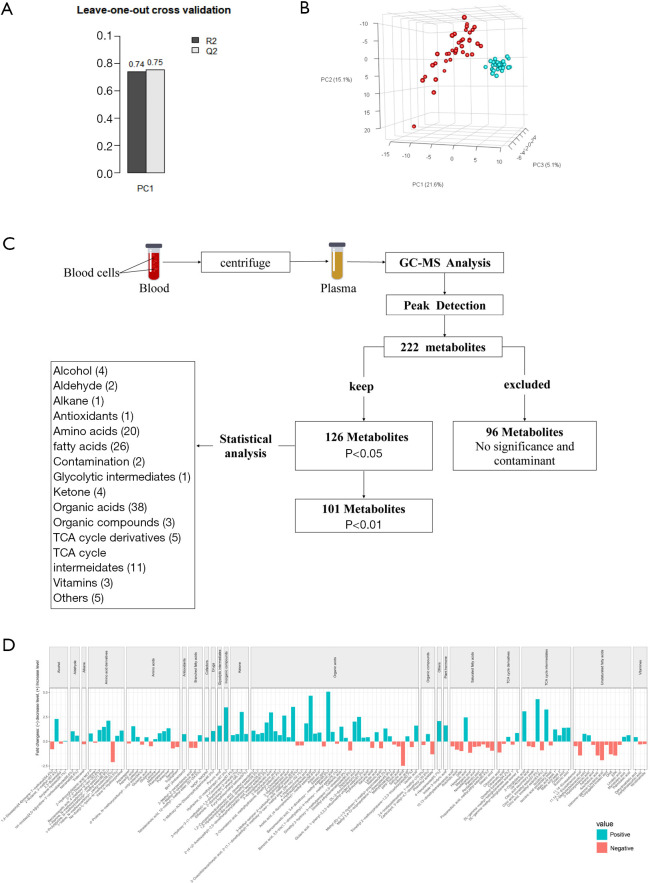
Figure 2.
Comparison of metabolites in the sepsis and control groups. (A) Leave-one-out cross validation of our study. (B) PLSDA of our study; red represents plasma metabolites in patients with sepsis, and blue represents plasma metabolites of controls. (C) Flow chart of GC–MS and statistical analyses results of metabolites. (D) Metabolites’ concentration gradient map after t test. Among these different metabolites, our study found that 26 metabolites were fatty acids including 3 branched fatty acids, 10 saturated fatty acids, and 13 unsaturated fatty acids that were found in sepsis plasma samples but not in the controls. P<0.05, comparison of sepsis patients and healthy controls. The name of metabolites is shown at the bottom, and the degree of matching with the compound in the National Institute of Standards and Technology (NIST) was marked in the form of n% after the name of the metabolites. The classification of the metabolites is shown at the top.

