Figure 2.
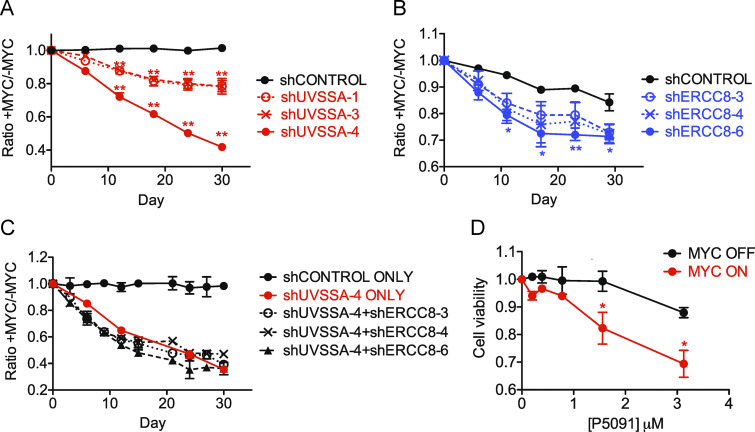
Down-regulation of the UVSSA–USP7–ERCC8 pathway sensitizes MCF10A cells to MYC overexpression. (A) FBCS assay with three unique shRNA clones targeting UVSSA. Each curve represents the ratio of fluorescent signal between MYC on and MYC off conditions (treated with 200 nM 4OHT or vehicle) for each cell line determined by FACS at the indicated time points during the assay. A downward slope denotes sensitivity to MYC deregulation. Asterisks indicate significant difference from shCONTROL at each time point (**, P < 0.01). Error bars represent the SEM (n = 4). (B) FBCS assay of cell lines expressing three unique shRNAs against ERCC8. Asterisks indicate significant difference from shCONTROL at each time point (**, P < 0.01; *, P < 0.05). Error bars represent the SEM (n = 4). (C) FBCS assay of cell lines expressing shUVSSA-4 in combination with one of three shRNA clones against ERCC8. No significant difference was found between shUVSSA-4 alone and any of the double knockdowns. Error bars represent the SEM (n = 2). (D) MTS assay in the presence of USP7 inhibitor P5091. MCF10A-MYC-ER cells were subjected to MTS assays in MYC OFF or MYC ON conditions using indicated doses of P5091. Asterisks indicate significant difference from MYC off at each concentration (*, P < 0.05). Error bars represent the SEM (n = 3).

