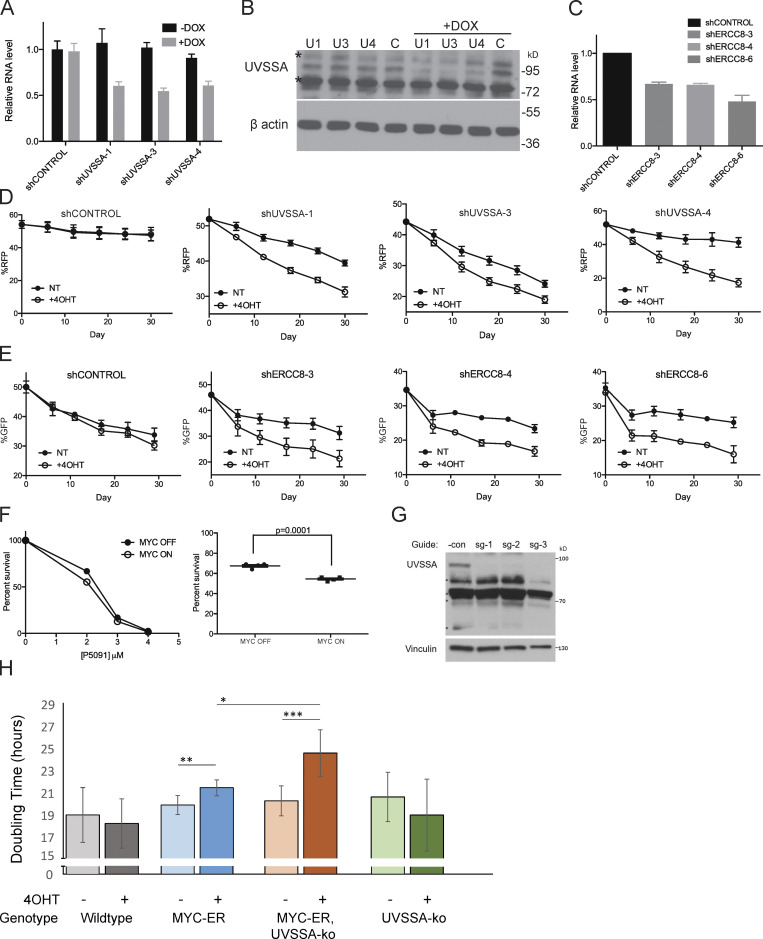
Figure S2.
Down-regulation, inhibition, or KO of UVSSA-USP7 or CSA/ERCC8 sensitizes MYC-overexpressing MCF10A cells. (A) qRT-PCR following knockdown of UVSSA. Three independent doxycycline (DOX)-inducible shRNA clones were used to produce stable UVSSA-knockdown cell lines. Black bars show UVSSA mRNA levels without shRNA induction, and gray bars show mRNA levels after 72 h of 1 µg/ml DOX treatment. Values were normalized to GAPDH. Error bars represent the SEM (n = 3). (B) Western blot following knockdown of UVSSA. Whole-cell lysates were prepared after 72 h of 1 µg/ml DOX treatment in stable cell lines with UVSSA knockdown and subjected to SDS-PAGE. Asterisks show nonspecific bands recognized by the UVSSA antibody. (C) qRT-PCR following knockdown of ERCC8. Three independent shRNA clones were used to produce stable ERCC8-knockdown cell lines. Values were normalized to GAPDH. Error bars represent the SEM (n = 3). (D) Representative raw data from UVSSA FBCS assays as seen in Fig. 2 A, comparing 4-hydroxy-tamoxifen (4OHT) treated and Not Treated (NT) conditions. Points denote RFP readings via FACS at the indicated time points. A shift in slope corresponds to sensitivity of each cell line to MYC-ER activation (treated with 200 nM 4OHT or vehicle). Error bars represent the SEM between technical replicates (n = 3). (E) Representative raw data from ERCC8 FBCS assays as seen in Fig. 2 B, comparing 4-hydroxy-tamoxifen (4OHT) treated and Not Treated (NT) conditions. Points denote GFP readings via FACS at the indicated time points. A shift in slope corresponds to the sensitivity of each cell line to MYC-ER activation (treated with 200 nM 4OHT or vehicle). Error bars represent the SEM between technical replicates (n = 3). (F) Clonogenicity assay following 24 h of treatment with varying doses of P5091 (treated with 200 nM 4OHT or vehicle). Percentage survival is based on colony numbers after 10 d of incubation. Left: A representative P5091 dose-dependent (0–4 µM) clonogenicity assay. Right: Clonogenicity difference between MYC on and MYC off cells after treatment with 2 µM P5091 for 24 h. P value was calculated from an unpaired t test (n = 4). (G) Western blot of UVSSA in iSTOP edited clonal lines. Cloned MCF10A lines edited by iSTOP using three different guides were lysed in radioimmunoprecipitation assay lysis buffer. The whole-cell lysates were then subjected to Western blot analysis using an anti-UVSSA antibody. The UVSSA-specific band is marked by an asterisk. Vinculin served as a loading control. *Nonspecific bands. (H) Doubling time for UVSSA-KO MCF10A cells. MCF10A cells with the indicated genotypes were grown with 4OHT (400 nM) or vehicle control for up to 6 d, and doubling time was calculated from cell counts, as described in the Materials and methods (n = 3, 4, 5, and 5, respectively). Statistical analysis was performed using Student’s t test, paired for intraline comparisons and unpaired for interline comparisons (*, P < 0.05; **, P < 0.01; ***, P < 0.005).

