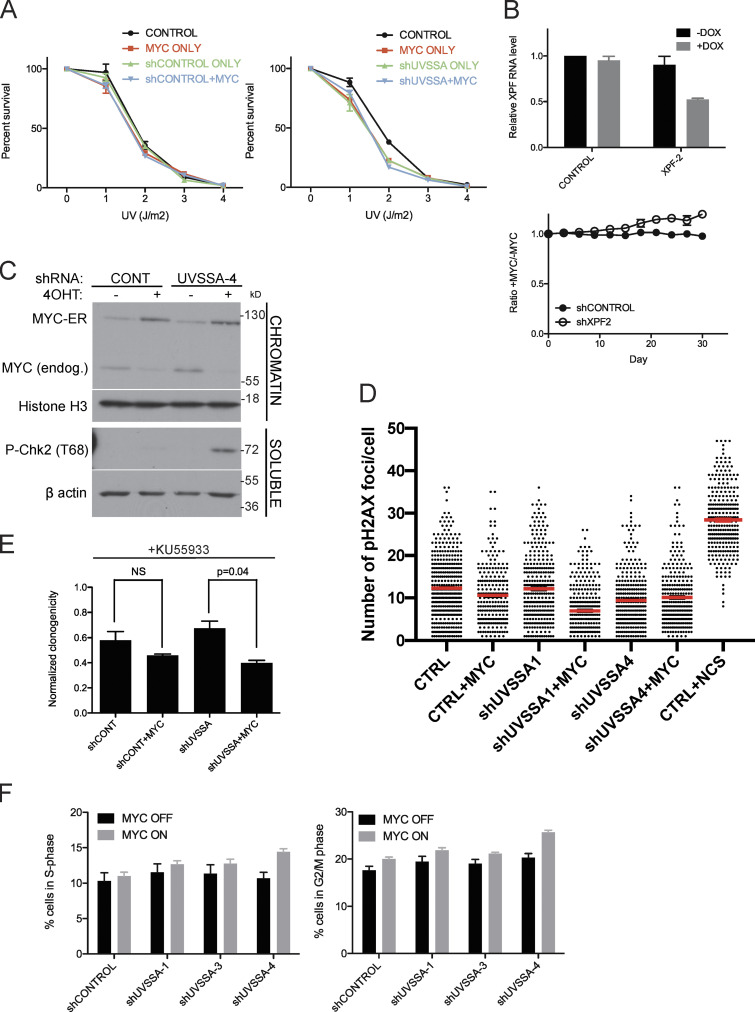
Figure S3.
Down-regulation of UVSSA elicits a DNA damage response in MYC-deregulated cells. (A) Clonogenicity assay following UV treatment. shCONTROL cells (left) or shUVSSA-4 cells (right) were treated with vehicle or 1 µg/ml doxycycline (DOX), in combination with 200 nM 4OHT or vehicle, and subjected to increasing doses of UV-C radiation. Percentage survival is based on colony numbers after 10 d of incubation. Error bars represent the SEM (n = 3). (B) XPF knockdown and FBCS assays. XPF was down-regulated using DOX-inducible shRNA (XPF-2). qRT-PCR shows XPF mRNA levels without shRNA induction in black and mRNA levels after 72 h of 1 µg/ml DOX treatment in gray (top). Values were normalized to GAPDH, and error bars represent the SEM (n = 3). shCONTROL and shXPF cells were subjected to FBCS assays with 1 µg/ml DOX and 200 nM 4OHT or vehicle (bottom). Survival is indicated as a ratio of RFP signal between MYC on and MYC off conditions. Error bars represent the SEM (n = 3). (C) Western blot showing CHK2 activation in MYC-deregulated UVSSA knockdown cells. Indicated cell lines were treated with 200 nM 4OHT or vehicle and 1 µg/ml DOX every 3 d and harvested at day 9. Following cell fractionation, chromatin-bound and soluble cytoplasmic fractions were run on SDS-PAGE gels and subjected to Western blot analysis with the indicated antibodies. Histone H3 served as a loading control. (D) Quantification of H2AX foci following MYC induction. Indicated cell lines were treated with 200 nM 4OHT or vehicle and 1 µg/ml DOX for 3 d before fixing and immunostaining with H2AX antibodies. NCS was used as a positive control. Red lines indicate means. (E) Clonogenicity assays were performed for shCONTROL or shUVSSA-4 cells treated with 31.5 µM KU55933. Statistical analysis was performed using t tests. Error bars represent the SEM (n = 3). (F) Representative raw data for Fig. 3 D. Fractions of cells in S phase (left) or G2/M phase (right) were measured using FACS after 30 d of culturing cells with 1 µg/ml DOX and 200 nM 4OHT or vehicle. Error bars represent the SEM (n = 3).

