Figure S4.
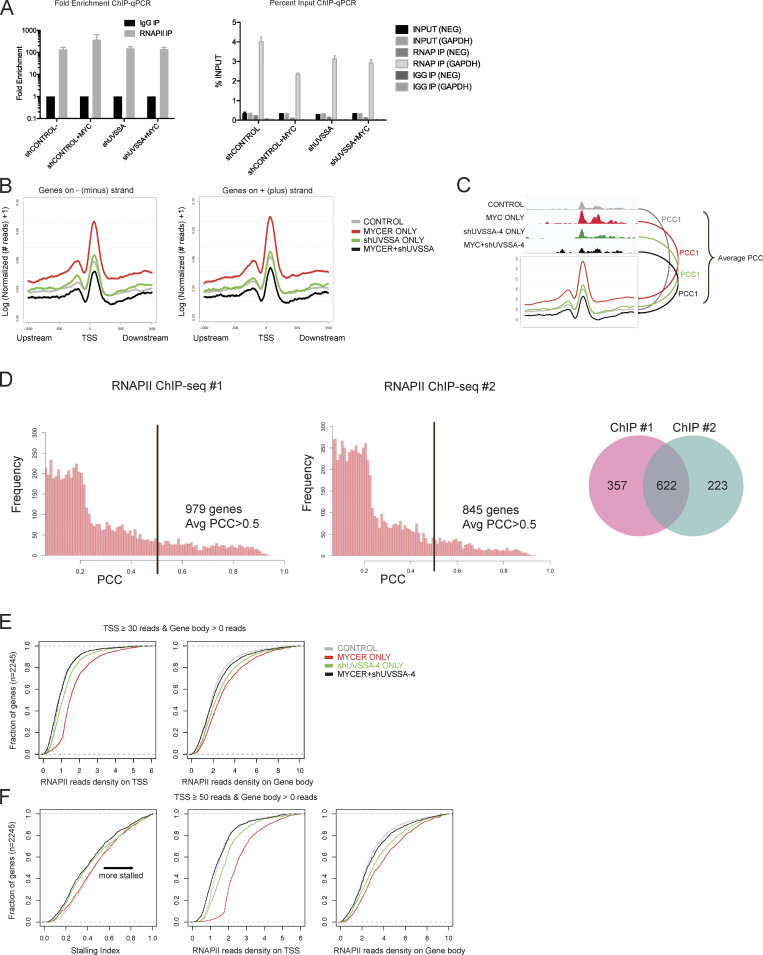
RNAPII ChIP-seq quality control, correlation analysis of replicates, and calculation of SIs. (A) RNAPII ChIP-qPCR results shown by fold enrichment (left) or percentage input (right). GAPDH primers serve as a positive control for RNAPII enrichment, while NEG primers serve as a negative control. n = 4. Error bars represent SEM. (B) Normalized ChIP-seq footprints in a 2-kb window of genomic TSSs. Curves for genes on either the minus (left) or plus (right) strands were plotted, respectively. The y axis indicates logarithmic transformation of normalized read depths plus one per site. (C) Schematic for PCC analysis. For each gene, the PCC was calculated between the averaged ChIP-seq footprint curve and corresponding raw read depths around the TSS ±300 bp. PCCs were then averaged over all four conditions. (D) Distributions of averaged PCCs of genes from RNAPII ChIP-seq replicates 1 and 2. The black bar denotes a PCC of 0.5. Venn plot for genes associated with average PCC >0.5. (E) Empirical distribution of normalized read density on gene promoter (left) and gene body (right) regions. Genes with at least 30 reads on the promoter and at least 1 read in the gene body were selected for this analysis, and the cumulative SIs are denoted in Fig. 5 B. (F) Empirical distribution of RNAPII SIs (left) and normalized read density (center, right) for genes with at least 50 reads on the promoter and at least 1 read in the gene body. IP, immunoprecipitation.

