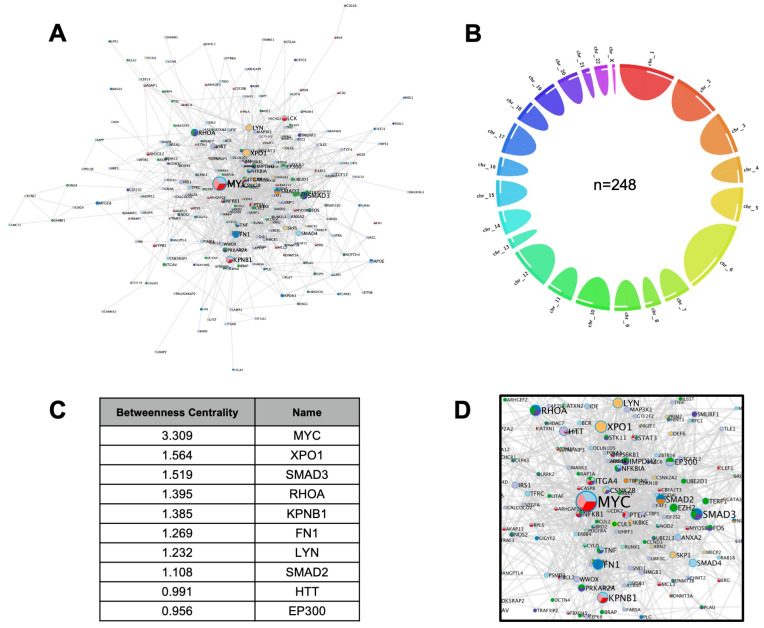
Figure 2. COVID-19 meta-interactome.
A) Network Representation: node size is proportional to Betweenness Centrality score. B) Circle plot showing the chromosome distribution of the 248 COVID-19 meta-interactome genes. C) Top 10 nodes ranked by Betweenness Centrality D) Detail of the network view showing the top nodes.

