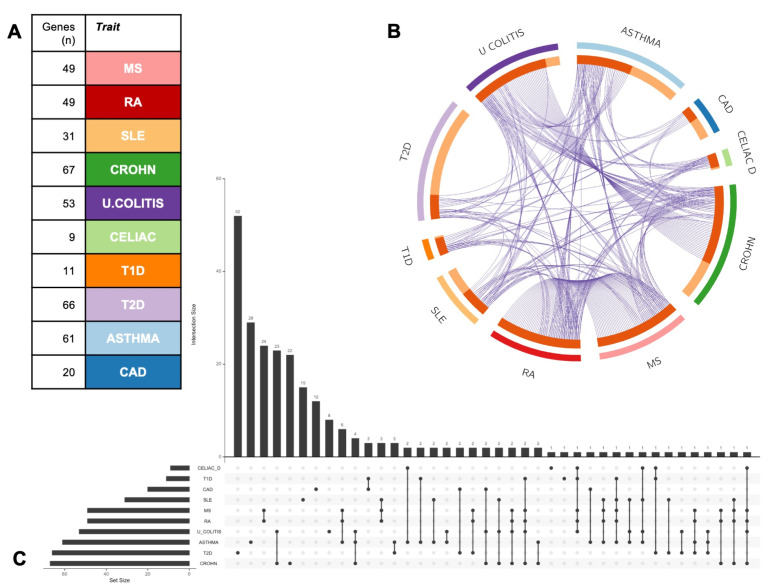
Figure 5. COVID-19 meta-interactome composition.
A) The table shows the subsets of genes from each trait contributing to the network composition. B) The circle plot shows the overlap between gene lists at the gene level, with purple curves linking identical genes. C) The UpsetPlot displays a schematic representation of the intersections among gene sets (x axis), with the respective size (y axis). MS: Multiple Sclerosis; RA: Rheumatoid Arthritis; SLE: Systemic Lupus Erythematosus; CROHN: Crohn’s Disease. U. COLITIS: Ulcerative Colitis; CELIAC D: Celiac Disease; T1D: Type 1 Diabetes Mellitus; T2D: Type 2 Diabetes Mellitus; CAD: Coronary Artery Disease.

