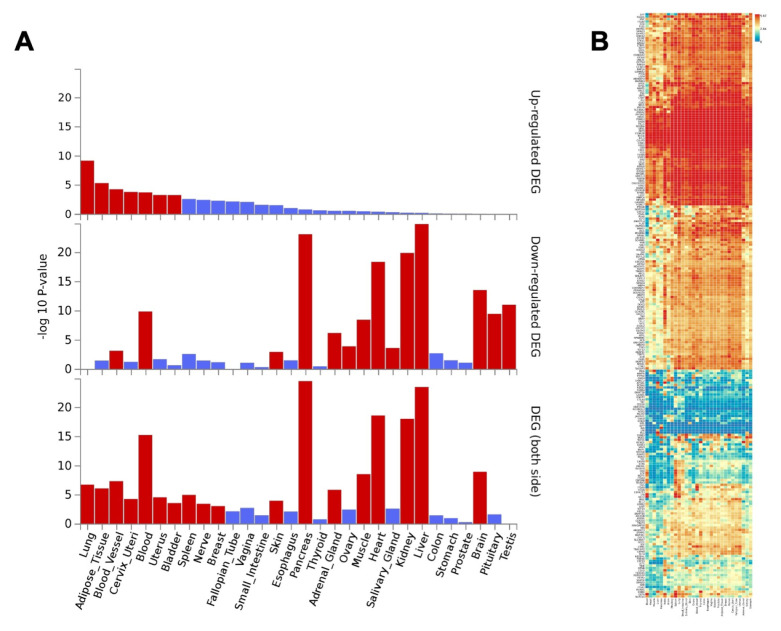
Figure 8. COVID-19 meta-interactome gene expression across human tissues.
A) Differentially Expressed Genes (DEGs) in GTEx v8 30 tissue types. Significantly enriched DEG sets (Pcorr < 0.05) are highlighted in red: the first graph shows DEGs overexpression, the second DEGs underespression, the third sums both side of regulation. B) Gene Expression Heatmap across GTEx v8 30 tissue types. Genes and tissues are ordered by clusters.

