
Figure 5.
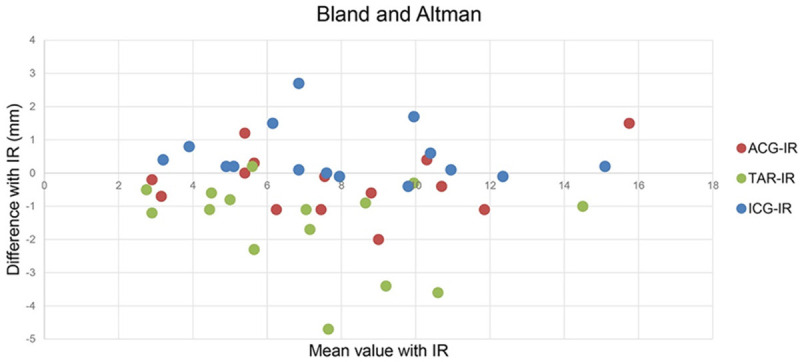
Differences in the values of various approaches (by arthroscopy and by software) relative to the gold standard (by incision) analyzed using the Bland-Altman method. ACG-IR: ACG minus IR; TAR-IR: TAR minus IR; ICG-IR: ICG minus IR. The horizontal axis represents the mean value of IR control with ACG, TAR, or ICG respectively; the perpendicular axis represents the differences of ACG, TAR, ICG respectively with IR control.