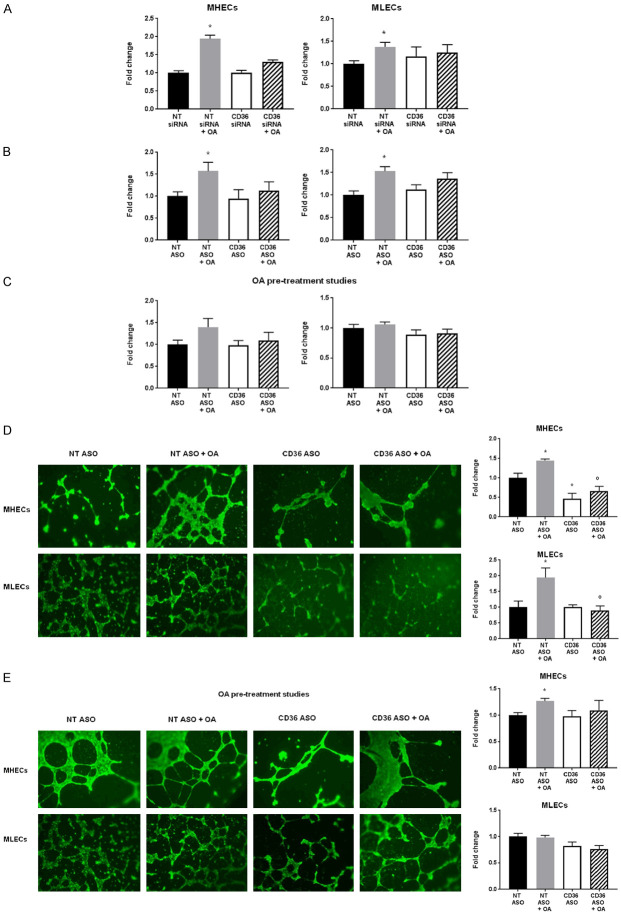
Figure 3.
Effect of oleic acid on transwell migration and tube formation in CD36-deficient MHECs and MLECs. A. Effect of siRNA-mediated CD36 knockdown on MHEC and MLEC migration compared to NT siRNA ECs in transwell migration assays stimulated by oleic acid (OA, 300 µmol/L) or control BSA (bottom chamber). Histograms show fold change in RFUs of fluorescent-labelled EC migration. Data represent mean ± SEM, n = 6, *P < 0.05 vs. NT siRNA; B. Effect of ASO-mediated CD36 knockdown on MHEC and MLEC migration compared to NT ASO ECs in transwell migration assays stimulated by oleic acid (OA, 300 µmol/L) or control BSA (bottom chamber). Histograms show fold change in RFUs of fluorescent-labelled EC migration. Data represent mean ± SEM, n = 6, *P < 0.05 vs. NT ASO; C. Effect of ASO-mediated CD36 knockdown and pre-treatment with oleic (OA, 300 µmol/L) on MHEC and MLEC migration compared to NT ASO ECs in transwell migration assays stimulated by 2% fetal bovine serum (FBS) (bottom chamber). Histograms show fold change in RFUs of fluorescent-labelled EC migration. Data represent mean ± SEM, n = 6. D. Effect of oleic acid (OA, 300 µmol/L) on ASO-mediated CD36 knockdown on MHEC and MLEC new vessel formation in Matrigel tube formation assays. Scale bars represent 100 μm. Histograms show fold change in a number of well-defined closed tube structures. Data represent mean ± SEM, n = 5, *P < 0.05 vs. NT ASO; E. Effect of ASO-mediated CD36 knockdown and pre-treatment with oleic acid (OA, 300 µmol/L) on MHEC and MLEC new vessel formation compared to control (CTRL) ECs in Matrigel tube formation assays. Scale bars represent 100 μm. Histograms show fold change in number of well-defined closed tube structures. Data represent mean ± SEM, n = 5, *P < 0.05 vs. NT ASO. Two-way ANOVA statistical tests were used to determine statistical significance.

