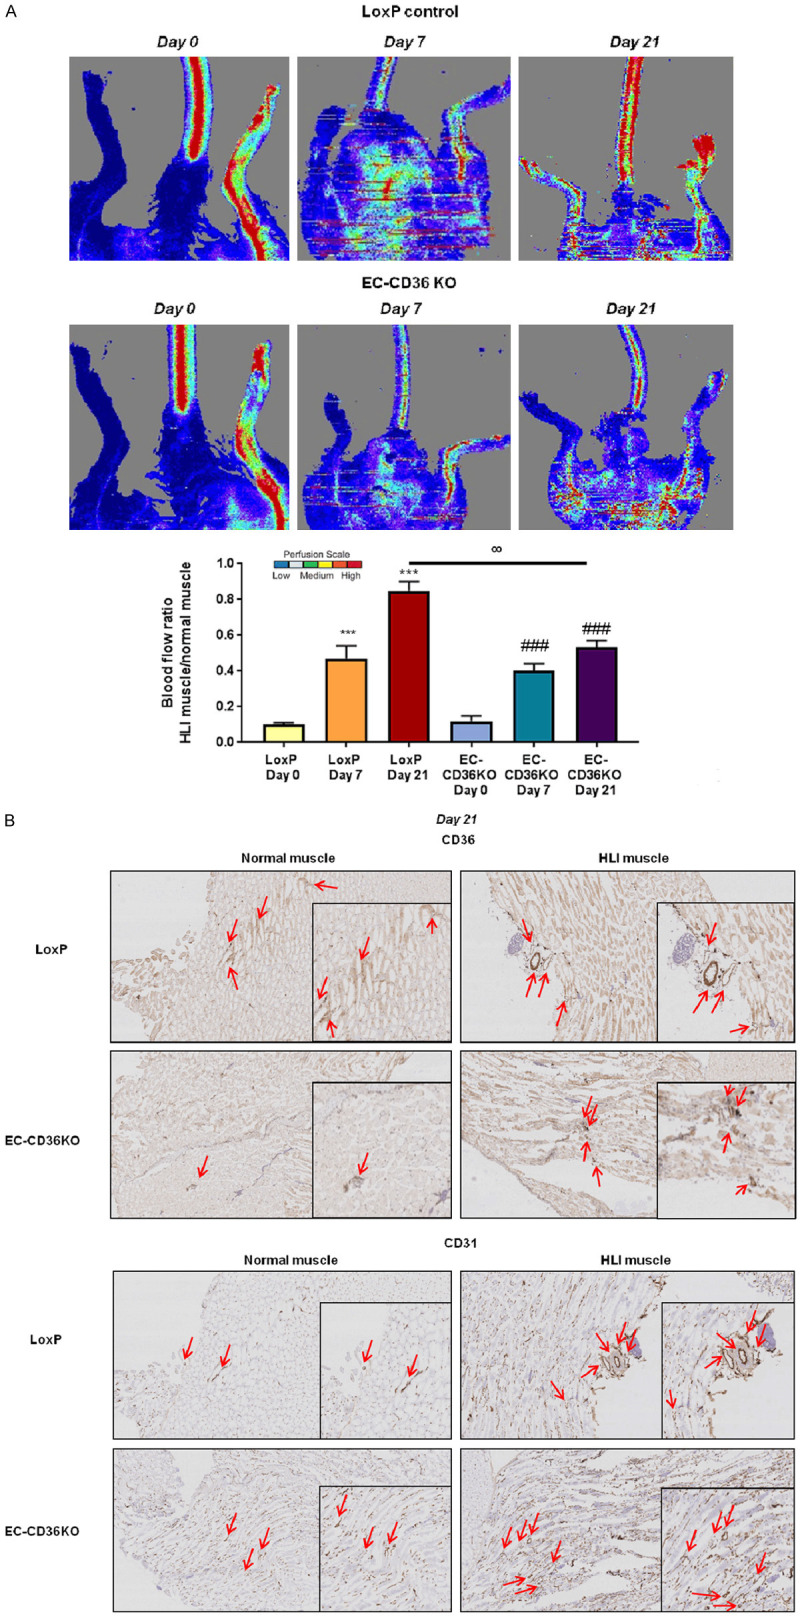
Figure 6.

In vivo hindlimb ischemia in EC-specific CD36 knockout mouse model. A. Representative images of blood flow by Laser Doppler imaging of normal and HLI muscle tissues of LoxP and EC-CD36 KO mice at day 0 (immediately after HLI) and days 7 and 21 post-ischemia, n = 7. Quantification of laser Doppler images of blood flow recovery in normal and HLI muscle tissues of LoxP and EC-CD36 KO mice at day 0 (immediately after HLI) and days 7 and 21 post-ischemia. Histograms show blood flow ratios of HLI muscle compared to normal muscle in control LoxP and EC-CD36 KO mice. Data represent mean ± SEM, n = 7, ***P < 0.001 vs. LoxP Day 0, ###P < 0.001 vs. EC-CD36 KO Day 0, °°P < 0.01 vs. LoxP Day 21; B. Representative images of immunohistochemical staining for CD36 and CD31 expression in normal muscle and HLI muscle from control LoxP and EC-CD36 KO mice at day 21 post-ischemia, n = 4. Scale bars represent 100 μm and 200 μm. Two-way ANOVA statistical tests were used to determine statistical significance.
