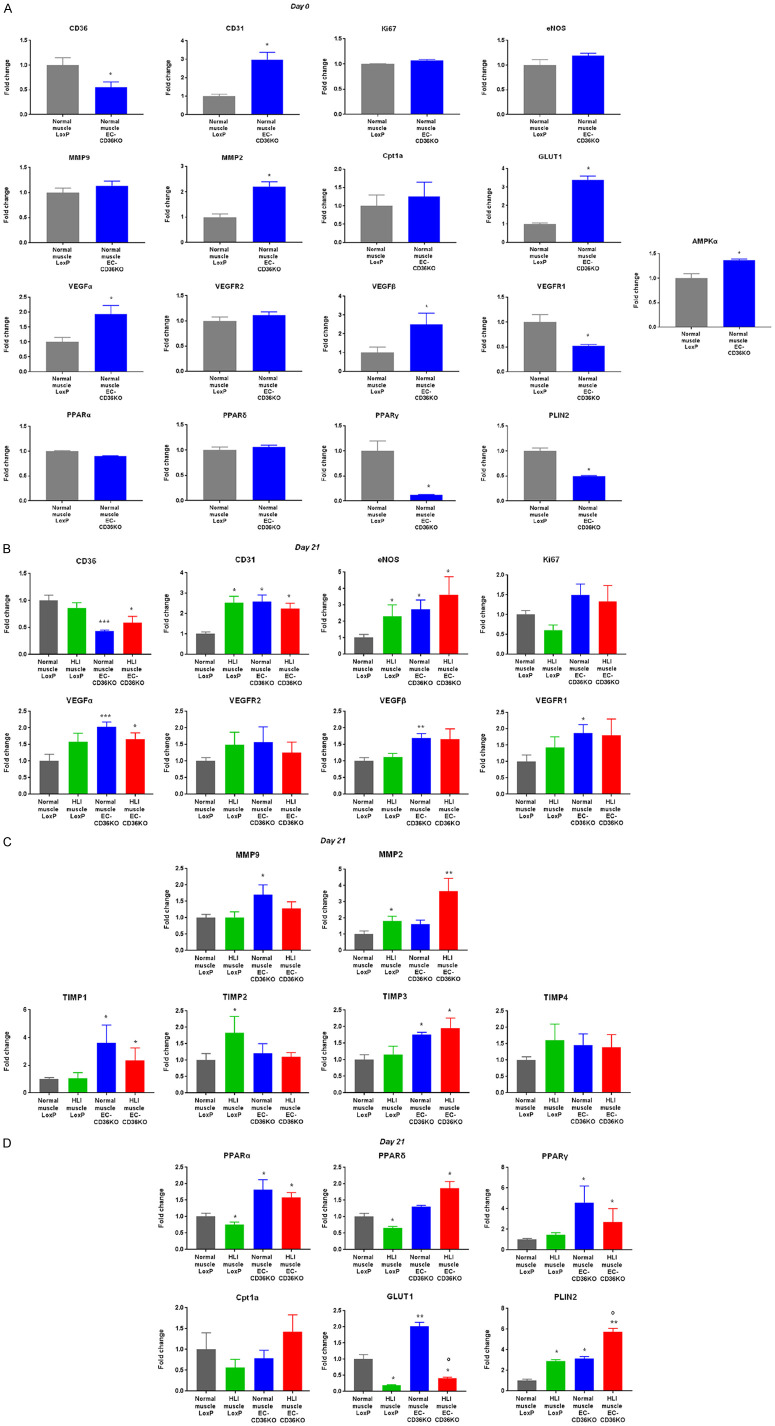
Figure 7.
Effect of EC-CD36 knockout in HLI mouse muscle tissues on endothelial, vascular and metabolic gene expression at 21 days post-HLI. In vivo hindlimb ischemia (HLI) mouse tissue mRNA expression in normal and HLI muscle tissues of LoxP and EC-CD36 KO mice of (A) baseline (day 0) vascular endothelial and angiogenic marker mRNA expression of CD36, CD31, Ki67, eNOS, MMP9, MMP2, VEGFα, VEGFR2, VEGFβ, VEGFR1, Cpt1a, GLUT1, PLIN2, and AMPKα assessed by quantitative realtime PCR (qRT-PCR). Histograms represent fold changes in mRNA expression normalized to RPS3 mRNA expression. Data represent mean ± SEM, n = 8, *P < 0.05 vs. normal muscle LoxP; (B) Day 21 post-ischemia mRNA expression of CD36, CD31, eNOS, Ki67, VEGFα, VEGFR2, VEGFβ, and VEGFR1. Histograms represent fold changes in mRNA expression normalized to RPS3 mRNA expression. Data represent mean ± SEM, n = 8, *P < 0.05, **P < 0.01, ***P < 0.001 vs. normal muscle LoxP; (C) Day 21 post-ischemia mRNA expression of MMP9, MMP2, TIMP1, TIMP2, TIMP3, and TIMP4. Histograms represent fold changes in mRNA expression normalized to RPS3 mRNA expression. Data represent mean ± SEM, n = 8, *P < 0.05, **P < 0.01 vs. normal muscle LoxP; (D) Day 21 post-ischemia mRNA expression of Cpt1a, GLUT1, and PLIN2. Histograms represent fold changes in mRNA expression normalized to RPS3 mRNA expression. Data represent mean ± SEM, n = 8, *P < 0.05, **P < 0.01 vs. normal muscle LoxP, °P < 0.01 vs. normal muscle EC-CD36 KO. One-way and two-way ANOVA statistical tests were used to determine statistical significance.

