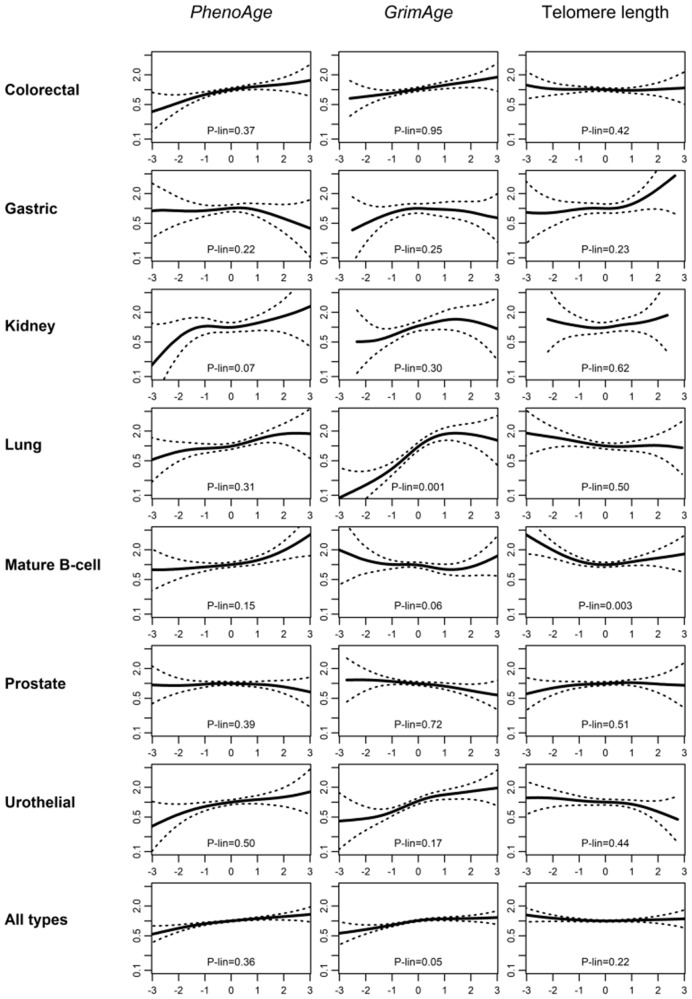
Figure 1.
Assessment of linearity. Relative cancer rates for age-adjusted PhenoAge, GrimAge, and predicted telomere length for 7 cancer types and overall in the Melbourne Collaborative Cohort Study. Model 1 was used (no other adjustment than that provided by the matching variables). x-axis: methylation-based measures of aging. All measures were expressed as Z scores (mean = 0, SD = 1), so that approximately 95% of the values are between –2 and 2. y-axis: Relative cancer rate, using as a reference (y = 1) the median value of the methylation-based measure distribution. P values (P-lin) are from a likelihood ratio test comparing P-spline and linear models.

