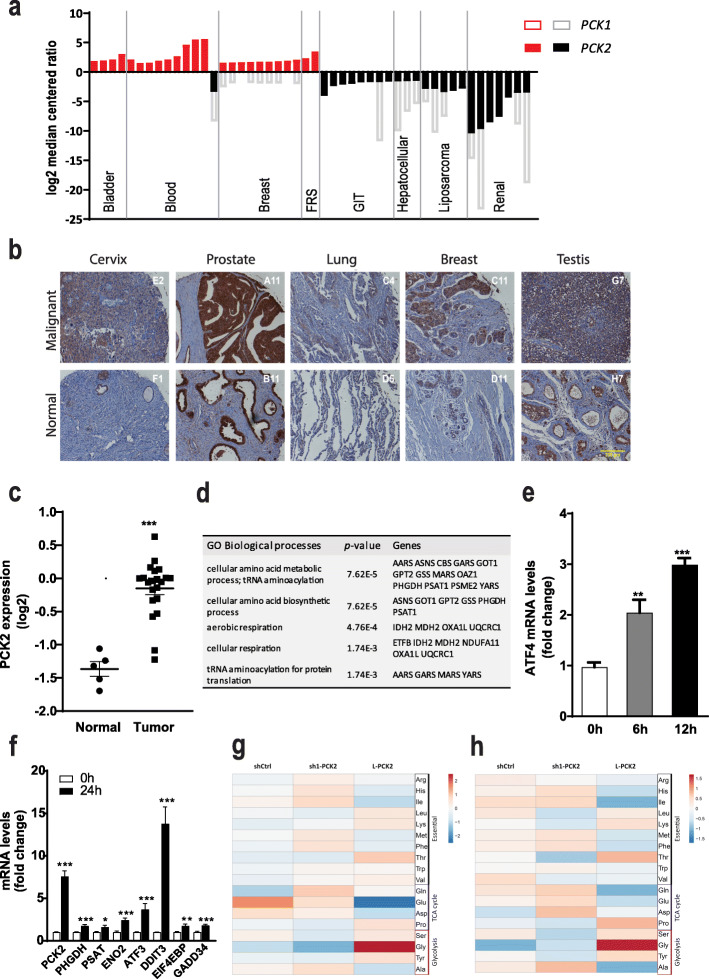
Fig. 1.
PEPCK-M is the PEPCK isoform preferentially expressed in tumors of diverse origin. a PCK1 and PCK2 expression in tumors from various tissues (FRS stands for female reproductive system, and GIT stands for gastro-intestinal). Graphical representation of log2 median-centered ratio of PCK1 (empty bars) and PCK2 (solid bars) present in each dataset analyzed using Oncomine at oncomine.org (analysis type: cancer versus normal, threshold at P = 1E−5 and top gene rank 10%, see references in Supplementary Table 1). Red or black colored boxes represent overexpressed or underexpressed for each dataset, respectively. Missing values for PCK1 expression were not significant or were not present in dataset. b Immunohistochemical analysis of PEPCK-M expression in selected types of tumors and their matched non-neoplastic tissue microarray BCN962 (US Biomax). Tissue was briefly counterstained with hematoxylin. Scale bar = 200 μm. c PCK2 gene expression (log2) from a microarray dataset comparing tumor samples of 35 patients with early stage cervical cancer and 5 normal cervical tissue samples. Statistical significance was determined by unpaired two-tailed Student’s t test. d Gene ontology analysis of 100 first hits co-expressing with PCK2 in human cervical cancer datasets analyzed using SEEK (Search-Based Exploration of Expression Compendium, Princeton), a gene co-expression search engine. q value minimum FDR and p value adjusted per multiple hypothesis testing Benjamini-Hockberg. e, f Quantitative real-time PCR analysis of mRNA levels of ATF4 at 6 h and 12 h (e), and selected genes at 24 h (f) in HeLa shCtrl cells grown in DMEM medium without glucose. Data is normalized to 0 h. Statistical significance compared with 0 h was determined by unpaired two-tailed Student’s t test. g, h Heatmap of amino acid distribution. Molar fraction of AA was determined in the cell extracts of HeLa cells grown for 24 h in high-glucose (25 mM) (g) and in glucose exhaustion (1 mM) (h) conditions. Data were processed and visualized by using ClustVistool with Pareto scaling (Metsalu & Vilo, 2015). Comparison of samples is realized within the rows

