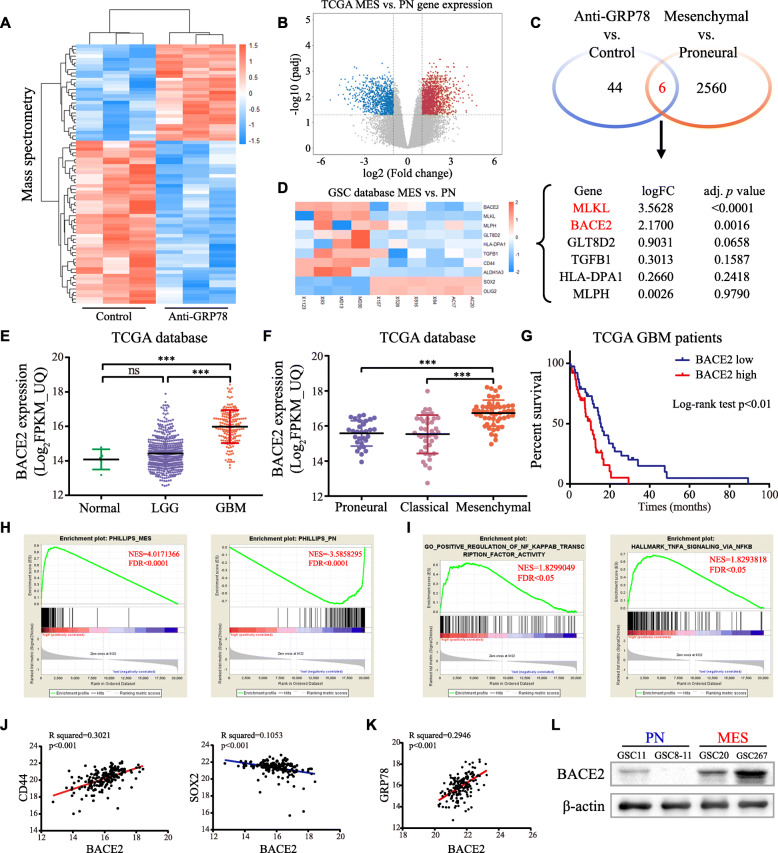
Fig. 4.
Screen BACE2 as a candidate of csGRP78 downstream molecule. a Heat map shows the differential proteins acquired by mass spectrometry. Anti-GRP78 versus Isotype, blue indicates downregulation while red indicates upregulation. b mRNA profile distinguishes PN GBMs from MES GBMs in TCGA database. c Compared downregulated proteins in anti-GRP78 versus isotype with upregulated genes in MES-subtype GBMs, overlapping total 6 genes. d Statistical analysis for differential expression of these 6 candidates in mRNA profiling of MES and PN GSCs (GSE67089). e BACE2 mRNA expression in normal tissues, low-grade glioma (LGG) and GBM from TGCA database. f BACE2 mRNA expression in TCGA database grouped by subtype. g Survival curve and log-rank test for GBM patients stratified by the BACE2 expression from TCGA database. h GSEA indicates expression of BACE2 positively correlated with MES subtype, while negatively with PN subtype. i GSEA shows BACE2 has the strong correlation with NF-κB pathway. j Correlation between expression of BACE2 with selected MES and PN signatures in TCGA database. k Correlation analysis for expression of BACE2 and GRP78 in TCGA database. l western blot analysis for BACE2 in GSC11, 8–11,20 and 267. *p < 0.05, **p < 0.01, ***p < 0.001

