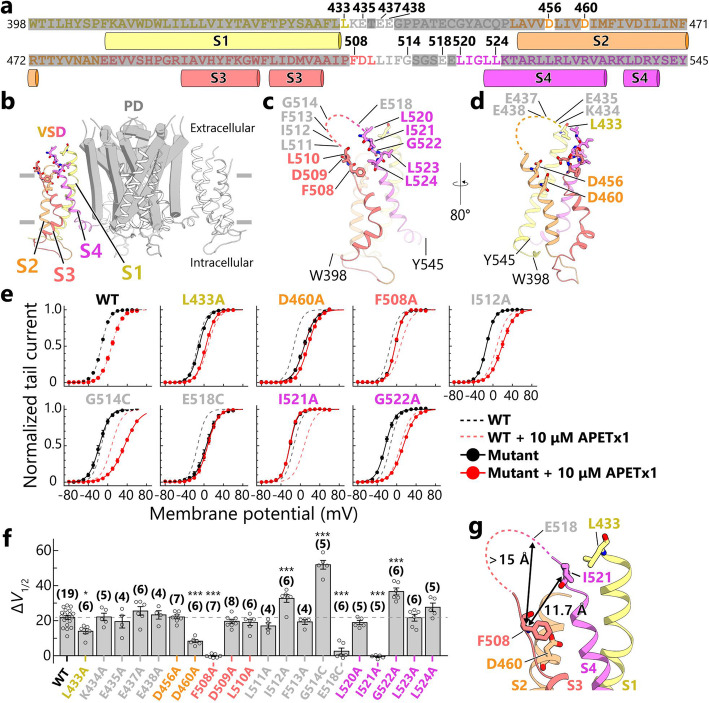
Fig. 4.
Inhibition of hERG mutants by APETx1. a The primary structure of the hERG VSD, colored as follows: S1, yellow; S2, orange; S3, pale red; and S4, magenta. The residues that are missing in a cryo-EM structure [17] are colored with gray. Non-mutated residues are drawn with semi-transparent gray marker to highlight the mutated residues. b The transmembrane domain of the cryo-EM structure of hERG with S4-up conformation (PDB code: 5VA2) [17]. The VSDs are represented as ribbons, one of which is colored as in (a); the others are white. The PD is represented as a gray cartoon. c, d A detailed illustration of the hERG VSD, corresponding to the sequence shown in (a). The mutated residues are represented as sticks. The residues in the extracellular region that are missing in the cryo-EM structure of hERG are depicted as dashed lines. e Normalized G-V curves (mean ± SEM) of hERG mutants showing ΔV1/2 values that are significantly different from those of WT, in the absence (black solid line) or presence (red solid line) of 10 μM APETx1. The fitting curves of WT in the presence (black dashed line) and absence (red dashed line) of 10 μM APETx1 are superimposed on those of the mutants. f The ΔV1/2 values of 10 μM APETx1 in hERG-mutants are represented as the mean values ± SEM; the number of experiments is shown in parentheses. Multiple-group comparison was performed by one-way ANOVA followed by Tukey’s test (∗, 0.01 ≤ p < 0.05; ∗∗, 0.001 ≤ p < 0.01; ∗∗∗, p < 0.001). g Close-up view of the residues that yielded mutations that decreased the hERG inhibition by APETx1. The distance between the Cβ atoms of F508 and I521 are 11.7 Å, and the distance between F508 and E518 is at least 15 Å

