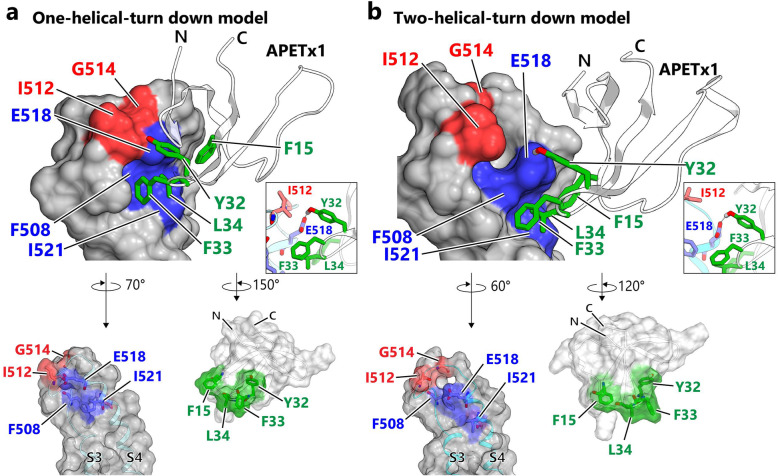
Fig. 5.
Structural models of the APETx1-VSD complex that satisfies the results of the mutational analysis. APETx1 docked to the one- and two-helical-turn-down model of hERG VSD in (a) and (b), respectively. The models exclude the S1 and S2 regions, which do not come into contact with APETx1, for clarity. The models of the hERG S3-S4 regions are represented as molecular surfaces colored according to the residues that yielded mutations that decreased (blue) and increased (red) inhibition by APETx1. APETx1 is represented as a ribbon with green sticks representing the key residues involved in hERG inhibition. Close-up view of the hydrogen bond between APETx1 Y32 and hERG E518 is shown in inset. “Open-book” representations of the interaction interfaces are also drawn as semi-transparent molecular surfaces with ribbon representation

