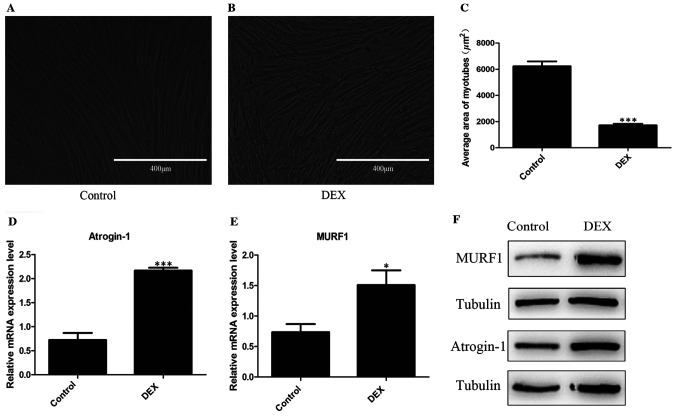
Figure 1.
Establishment of the DEX-induced muscle atrophy cell model. (A) and (B) C2C12 myotubes in the DEX-induced muscle atrophy group were thinner than that of the control group under optical microscope. (C) The average area of C2C12 myotubes was lower in DEX-induced muscle atrophy C2C12 cells than in control cells. An increase in the mRNA levels of (D) MURF1 and (E) Atrogin-1 was observed in starved C2C12 cells. (F) An increase in the protein levels of MURF1 and Atrogin-1 was observed in starved C2C12 cells. *P<0.05 and ***P<0.001 vs. control. DEX, dexamethasone; MURF1, muscle RING finger protein 1.

